

OpenPyXL is a Python module for interacting with Excel(.xlxs) files. But can’t you do that with Pandas? Yes, you can, but Pandas does support charts, formulae or images. OpenPyXL enables data scientists and data analysts to perform all kinds of operations on Excel workbooks:
- Read and write cells.
- Create and rename sheets.
- Draw charts.
- Add formulae.
- Create pivot tables.
- Insert images, and even do formatting and styling.
Another notable thing about OpenPyXL is that it doesn’t require an install of Microsoft Excel.
Working with Excel Files in Python
Excel files that we will work with are called workbooks; these contain a minimum of one sheet and a maximum of tens of sheets. Each of the sheets consists of rows starting from 1 and columns starting from A. The intersections of these rows and columns form cells that can store data of any type.
Install OpenPyXL form PyPI:
pip install openpyxl
Workbook & Worksheet
You can either read an existing .xlxs file using the load_workbook() method or create a new Workbook object. Let’s start by creating a new workbook:
 from openpyxl import Workbook, load_workbook
 wb = Workbook()
New Workbooks are always created with at least one sheet; you can access the current sheet using the active property:
 initial_sheet = wb.active
 print(initial_sheet)
<Worksheet "Sheet">
You can also access the worksheets using the dictionary index, workbook[“sheet_name”], format. The name of a sheet can be changed using the title property:
initial_sheet.title = "Initial Sheet"
You can create additional sheets using OpenPyXL’s create_sheet() method which takes two optional arguments: the name of the sheet and its index:
 sheet_4 = wb.create_sheet("Sheet 4") # created as the last sheet
 sheet_1 = wb.create_sheet("Sheet 1", 0) # created at first position
 sheet_3 = wb.create_sheet("Sheet 3", -1) # inserted at the second last position
All the sheets in the Workbook can be listed using the sheetnames property:
print(wb.sheetnames)
['Sheet 1', 'Intial Sheet', 'Sheet 3', 'Sheet 4']
Writing to and reading from cells
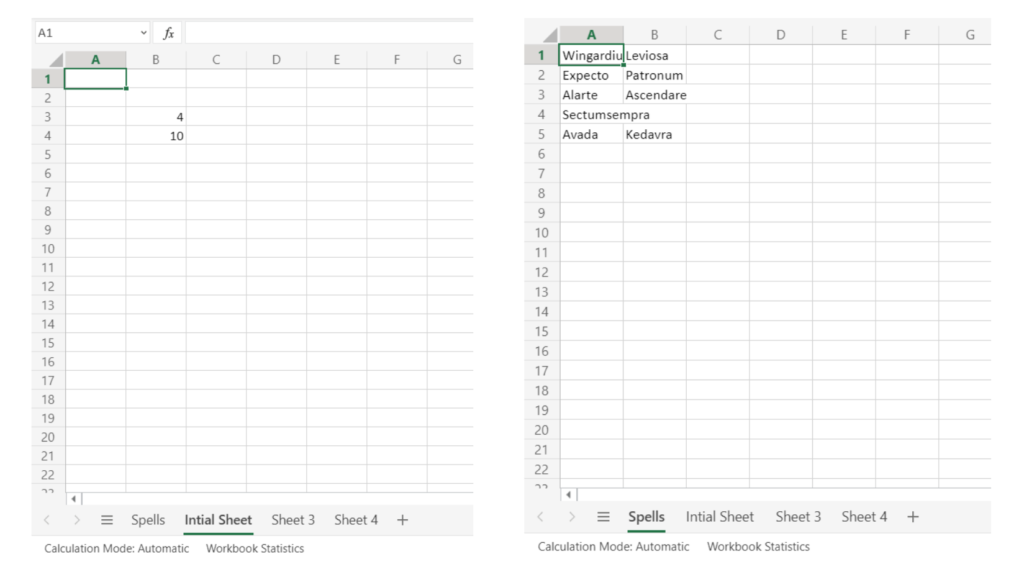
When a new worksheet is created in OpenPyXL, it has no cells; the cells are created when they are accessed. You can access the individual cells of a sheet using the keys of the worksheet or use the row and column notation using cell() method:
 initial_sheet['B3'] = 4
 initial_sheet.cell(row=4, column=2, value=10)
 # OR
 # initial_sheet.cell(row=4, column=2).value = 10
Another way to add write data is to write rows using the append() method:
 sheet_1.title = "Spells"
 sheet_1.append(["Wingardium", "Leviosa"])
 sheet_1.append(["Expecto", "Patronum"])
 sheet_1.append(["Alarte", "Ascendare"])
 sheet_1.append(["Sectumsempra"])
 sheet_1.append(["Avada", "Kedavra"])
There are three ways to read from multiple cells in OpenPyXL. The first method is the range operator. Let’s try reading each cell of the ‘Spells’ sheet using the range operator:
 cells = sheet_1["A1" : "B4"]
 for c1,c2 in cells:
     print(f"{c1.value} {c2.value}")
 Wingardium Leviosa
 Expecto Patronum
 Alarte Ascendare
 Sectumsempra None
The second way of reading multiple cells is by iterating over the rows using iter_row() function; which reads data one row at a time:
 for row in sheet_1.iter_rows(min_row=1, min_col=1, max_row=5, max_col=2):
     for cell in row:
         print(cell.value, end=" ")
     print()
 Wingardium Leviosa
 Expecto Patronum
 Alarte Ascendare
 Sectumsempra None
Similarly you can also read the data as columns using the iter_col() method:
 for row in sheet_1.iter_cols(min_row=1, min_col=1, max_row=5, max_col=2):
     for cell in row:
         print(cell.value, end=" ")
     print()
 Wingardium Expecto Alarte Sectumsempra Avada
 Leviosa Patronum Ascendare None Kedavra
Saving Workbooks
Whatever you have done so far has been saved in a Workbook object in memory, but no .xlxs file has been created. To access the workbook outside OpenPyXL, you need to save it:
wb.save('example.xlsx')
Drawing charts
Excel uses charts to visualize data. To create a chart in our OpenPyXl worksheets, we first need to define the chart type such BarChart, LineChart, etc. We also need to define the data to be used for the chart using a Reference object. Let’s writing some student performance data and plot a bar chart:
 from openpyxl.chart import BarChart, Reference
 sheet = wb['Sheet 3']
 sheet.title = "Performance"
 data = [
     ["Roll no", "Spell Making", " Astronomy and Herbology"],
     ["1", 86, 75],
     ["2", 42, 60],
     ["3", 66, 43],
     ["4", 82, 97],
     ["5", 84, 63],
     ["6", 73, 54],
     ["7", 92, 86],
 ]
 for row in data:
     sheet.append(row)
 chart = BarChart()
 values = Reference(worksheet=sheet,
                  min_row=1,
                  max_row=8,
                  min_col=2,
                  max_col=3)
 chart.add_data(values, titles_from_data=True)
 sheet.add_chart(chart, "E2")
 wb.save("example_chart.xlsx")

You can learn more about the charts available in OpenPyXL here.
Using Formulae
To add a formula to a cell in OpenPyXL, you simply need to define the formula as a string in the required cell. Let’s try calculating the average marks for the two subjects:
 sheet = wb['Sheet 4']
 sheet.title = "Formula"
 data = [
     ["Roll no", "Spell Making", " Astronomy and Herbology"],
     ["1", 86, 75],
     ["2", 42, 60],
     ["3", 66, 43],
     ["4", 82, 97],
     ["5", 84, 63],
     ["6", 73, 54],
     ["7", 92, 86],
     ["Average"]
 ]
 for row in data:
     sheet.append(row)
 cell = sheet.cell(row=9, column=2)
 cell.value = "=AVERAGE(B1:B8)"
 cell = sheet.cell(row=9, column=3)
 cell.value = "=AVERAGE(C1:C8)"
 wb.save('formula.xlsx')

Adding Images
Although images are not as common as charts or formulae, sometimes they can be used to enrich worksheets and make them more visually appealing. To work with images in OpenPyXL, you’ll need to install the Pillow module. OpenPyXL provides the add_image() method for adding images to a specified cell:
 from openpyxl import load_workbook
 from openpyxl.drawing.image import Image
 initial_sheet = wb['Intial Sheet']
 logo = Image("AIM-Logo.jpg")
 logo.height = 250
 logo.width = 250
 initial_sheet.add_image(logo, "E2")
 wb.save("logo.xlsx")

The code for the above implementation can be found in a Colab notebook here.
To learn more about OpenPyXL, refer to the official documentation.