
We at Cloudflare are long time Kafka users, first mentions of it date back to beginning of 2014 when the most recent version was 0.8.0. We use Kafka as a log to power analytics (both HTTP and DNS), DDOS mitigation, logging and metrics.
 Firehose CC BY 2.0 image by RSLab
While the idea of unifying abstraction of the log remained the same since then (read this classic blog post from Jay Kreps if you haven't), Kafka evolved in other areas since then. One of these improved areas was compression support. Back in the old days we've tried enabling it a few times and ultimately gave up on the idea because of unresolved issues in the protocol.
Kafka compression overview
Just last year Kafka 0.11.0 came out with the new improved protocol and log format.
The naive approach to compression would be to compress messages in the log individually:
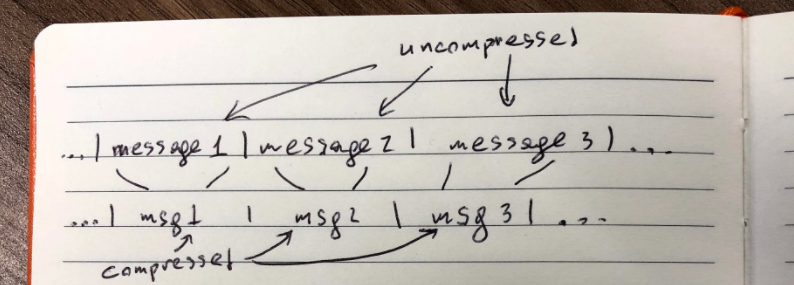
Edit: originally we said this is how Kafka worked before 0.11.0, but that appears to be false.
Compression algorithms work best if they have more data, so in the new log format messages (now called records) are packed back to back and compressed in batches. In the previous log format messages recursive (compressed set of messages is a message), new format makes things more straightforward: compressed batch of records is just a batch.
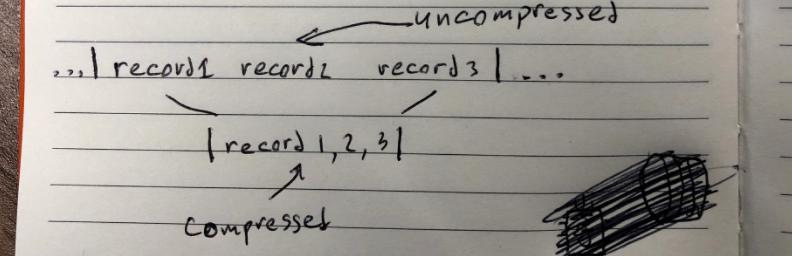
Now compression has a lot more space to do its job. There's a high chance that records in the same Kafka topic share common parts, which means they can be compressed better. On the scale of thousands of messages difference becomes enormous. The downside here is that if you want to read record3 in the example above, you have to fetch records 1 and 2 as well, whether the batch is compressed or not. In practice this doesn't matter too much, because consumers usually read all records sequentially batch after batch.
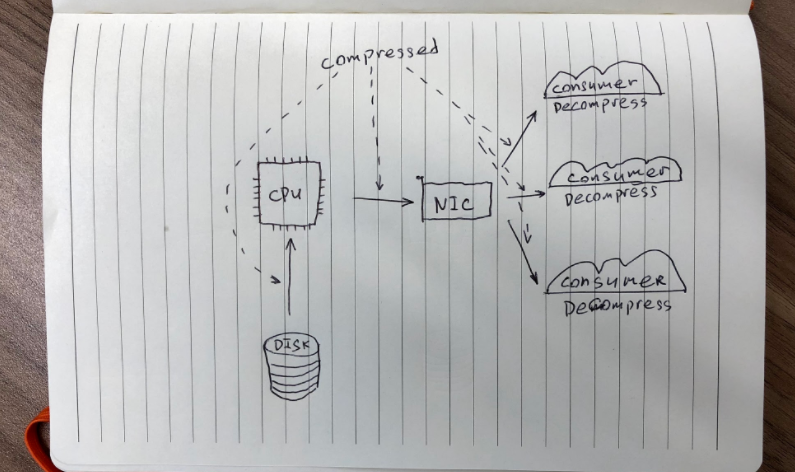
The beauty of compression in Kafka is that it lets you trade off CPU vs disk and network usage. The protocol itself is designed to minimize overheads as well, by requiring decompression only in a few places:
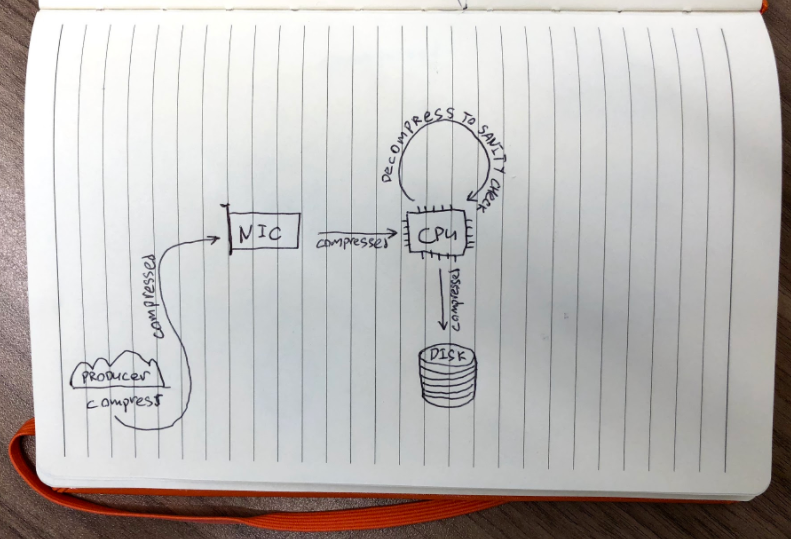
On the receiving side of the log only consumers need to decompress messages:
In reality, if you don't use encryption, data can be copied between NIC and disks with zero copies to user space, lowering the cost to some degree.
Kafka bottlenecks at Cloudflare
Having less network and disk usage was a big selling point for us. Back in 2014 we started with spinning disks under Kafka and never had issues with disk space. However, at some point we started having issues with random io. Most of the time consumers and replicas (which are just another type of consumer) read from the very tip of the log, and that data resides in page cache meaning you don't need to read from disks at all:
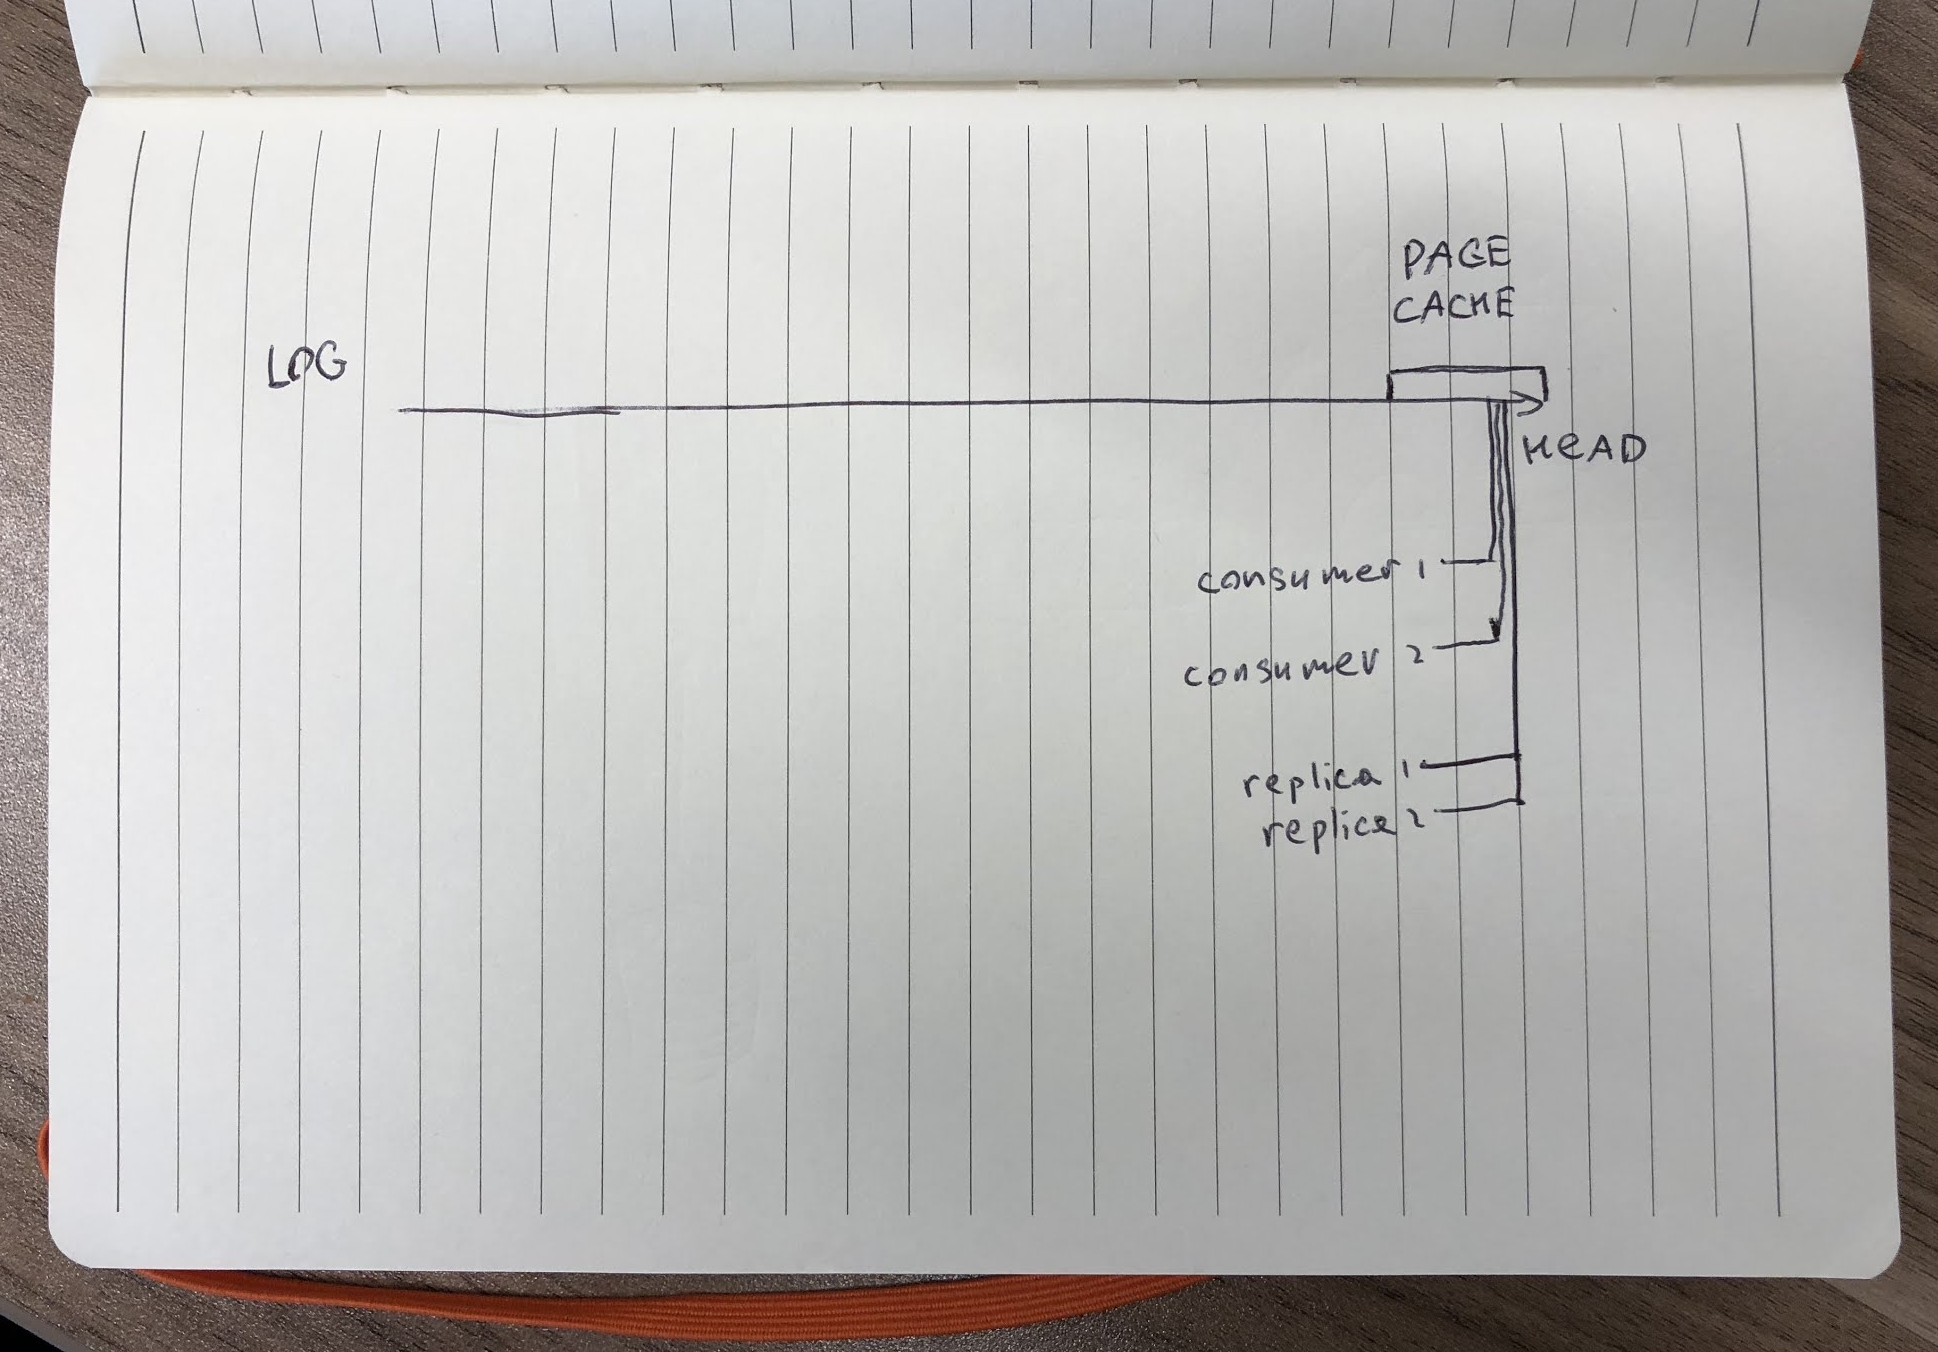
In this case the only time you touch the disk is during writes, and sequential writes are cheap. However, things start to fall apart when you have multiple lagging consumers:
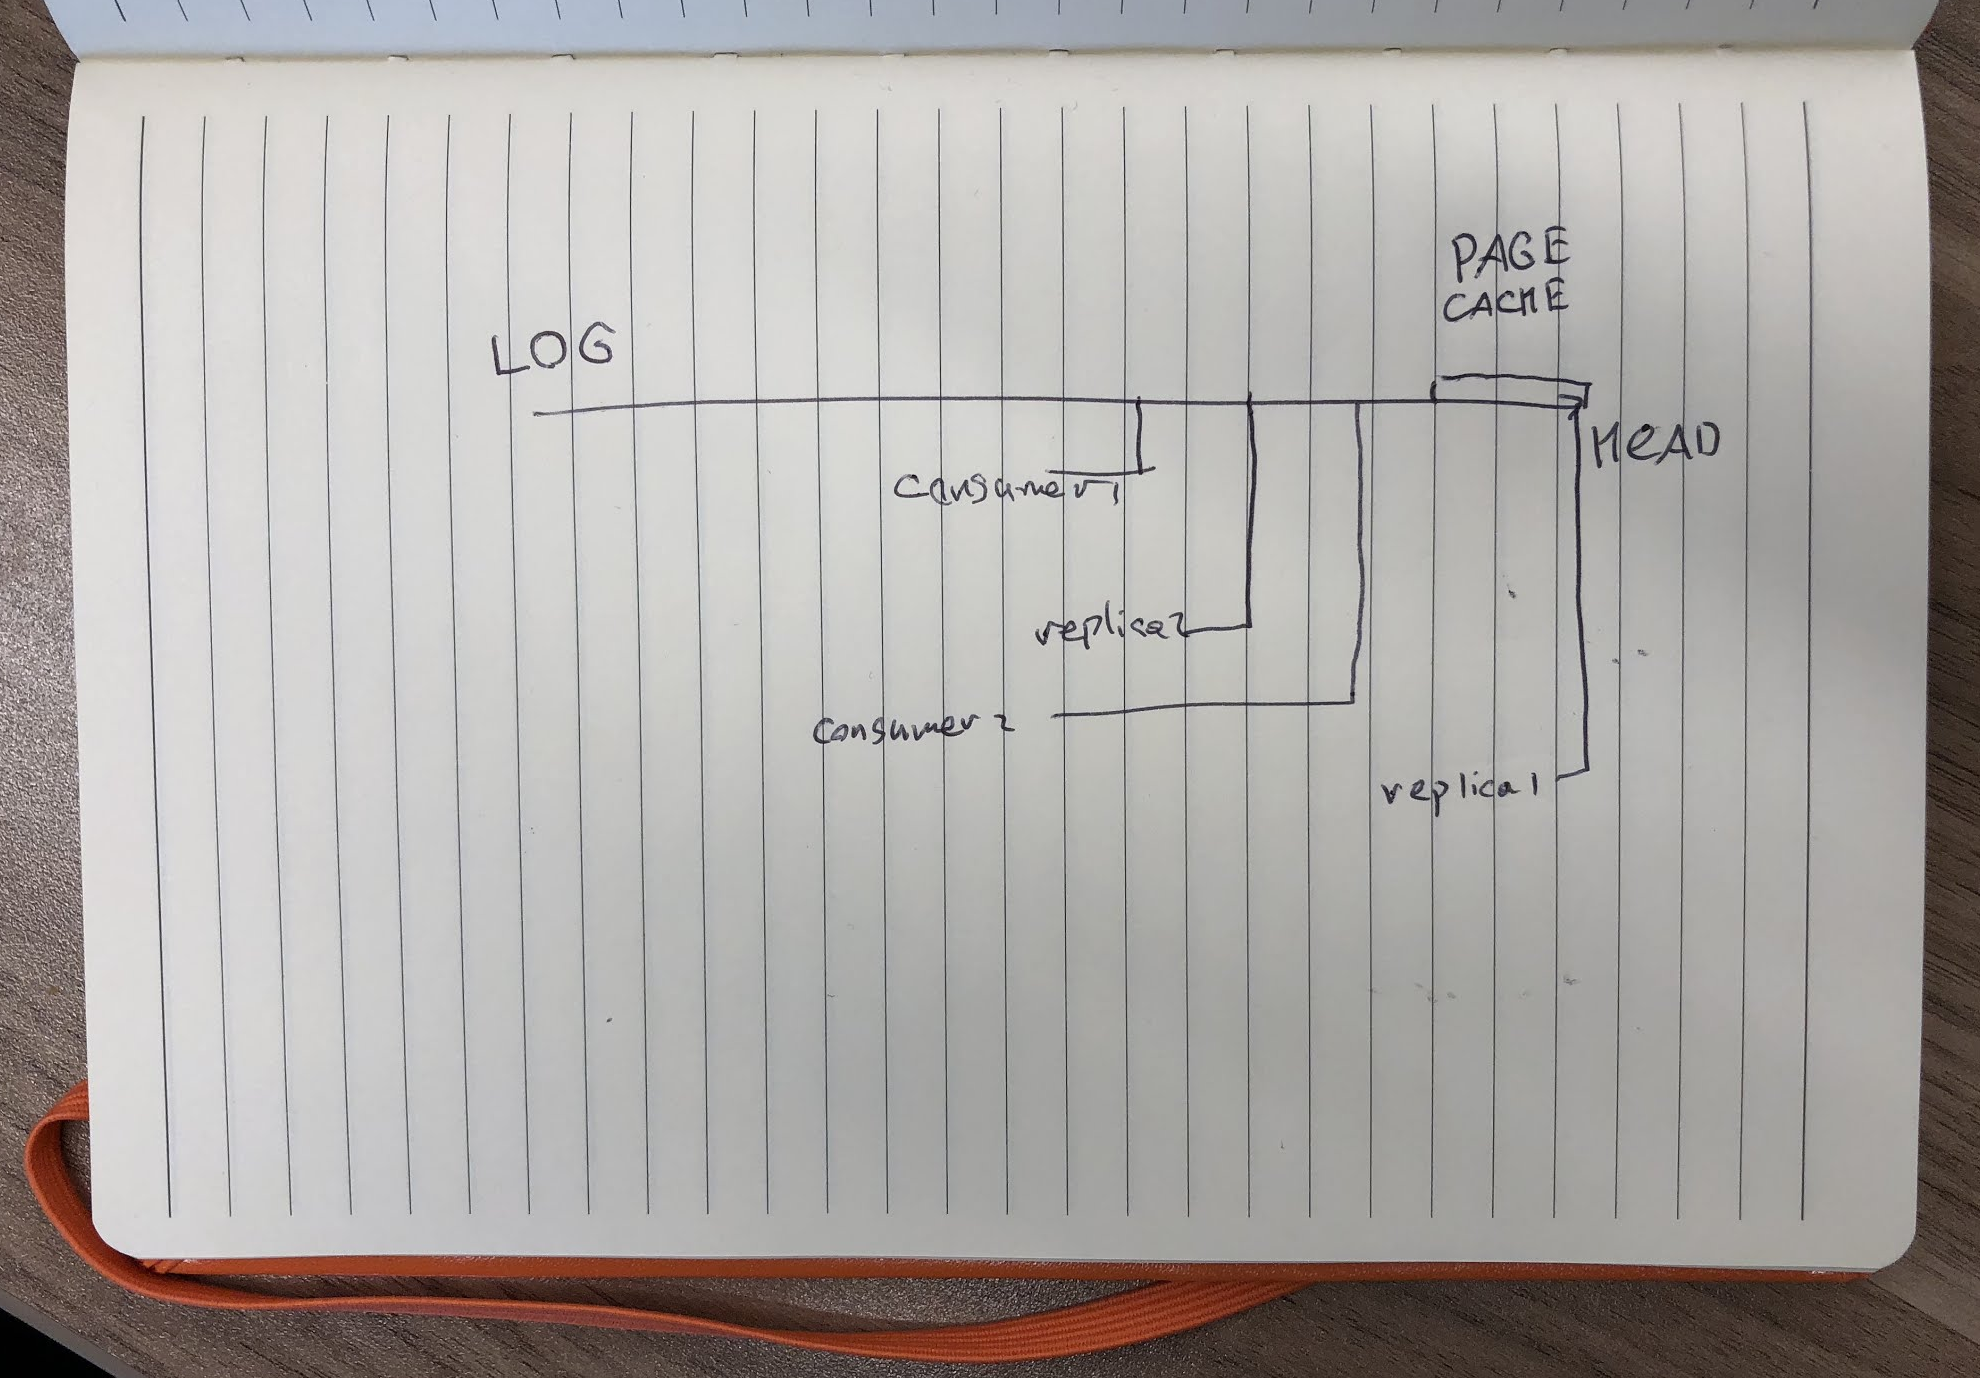
Each consumer wants to read different part of the log from the physical disk, which means seeking back and forth. One lagging consumer was okay to have, but multiple of them would start fighting for disk io and just increase lag for all of them. To work around this problem we upgraded to SSDs.
Consumers were no longer fighting for disk time, but it felt terribly wasteful most of the time when consumers are not lagging and there's zero read io. We were not bored for too long, as other problems emerged:
- Disk space became a problem. SSDs are much more expensive and usable disk space reduced by a lot.
- As we grew, we started saturating network. We used 2x10Gbit NICs and imperfect balance meant that we sometimes saturated network links.
Compression promised to solve both of these problems, so we were eager to try again with improved support from Kafka.
Performance testing
At Cloudflare we use Go extensively, which means that a lot of our Kafka consumers and producers are in Go. This means we can't just take off-the-shelf Java client provided by Kafka team with every server release and start enjoying the benefits of compression. We had to get support from our Kafka client library first (we use sarama from Shopify). Luckily, support was added at the end of 2017. With more fixes from our side we were able get the test setup working.
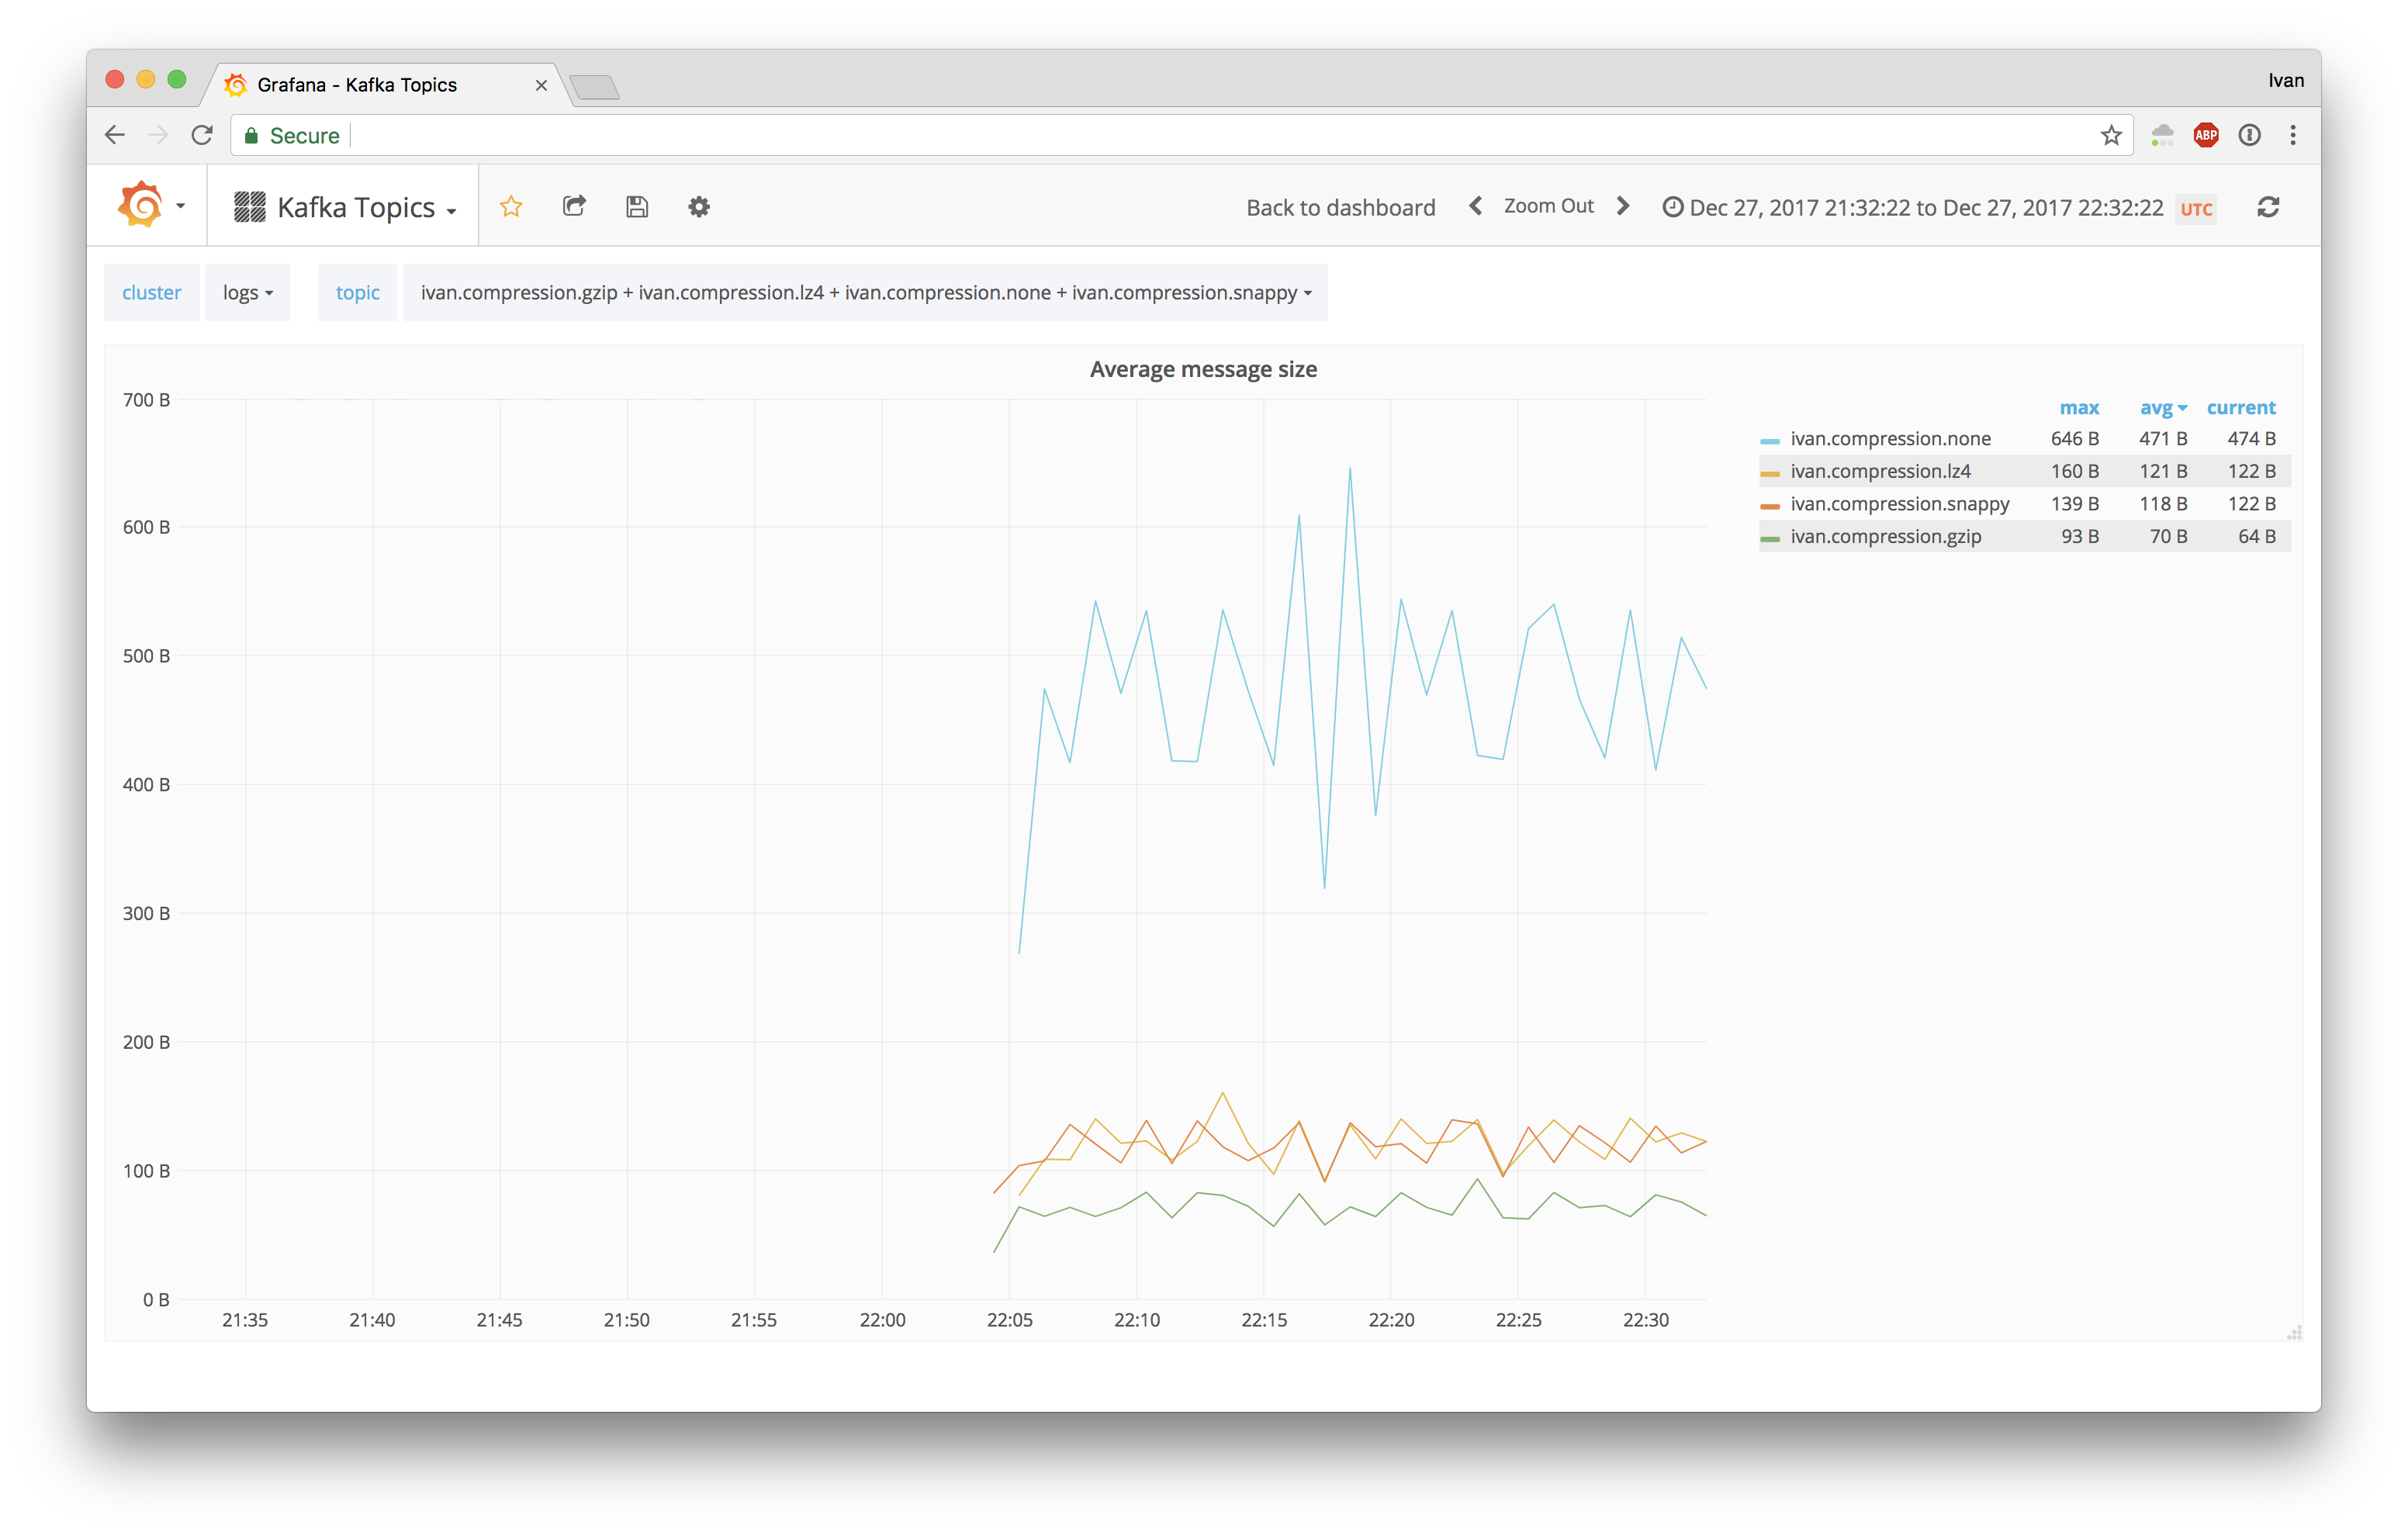
Kafka supports 4 compression codecs: none, gzip, lz4 and snappy. We had to figure out how these would work for our topics, so we wrote a simple producer that copied data from existing topic into destination topic. With four destination topics for each compression type we were able to get the following numbers.
Each destination topic was getting roughly the same amount of messages:

Ingress bandwidth was different for different topics, which is expected:

And the average size of messages was proportional to ingress bandwidth difference:
To make it even more obvious, this was the disk usage of these topics:

This looked amazing, but it was rather low throughput nginx errors topic, containing literally string error messages from nginx. Our main target was requests HTTP log topic with capnp encoded messages that are much harder to compress. Naturally, we moved on to try out one partition of requests topic. First results were insanely good:

They were so good, because they were lies. If with nginx error logs we were pushing under 20Mbps of uncompressed logs, here we jumped 30x to 600Mbps and compression wasn't able to keep up. Still, as a starting point, this experiment gave us some expectations in terms of compression ratios for the main target.
| Compression | Messages consumed | Disk usage | Average message size |
|---|---|---|---|
| None | 30.18M | 48106MB | 1594B |
| Gzip | 3.17M | 1443MB | 455B |
| Snappy | 20.99M | 14807MB | 705B |
| LZ4 | 20.93M | 14731MB | 703B |
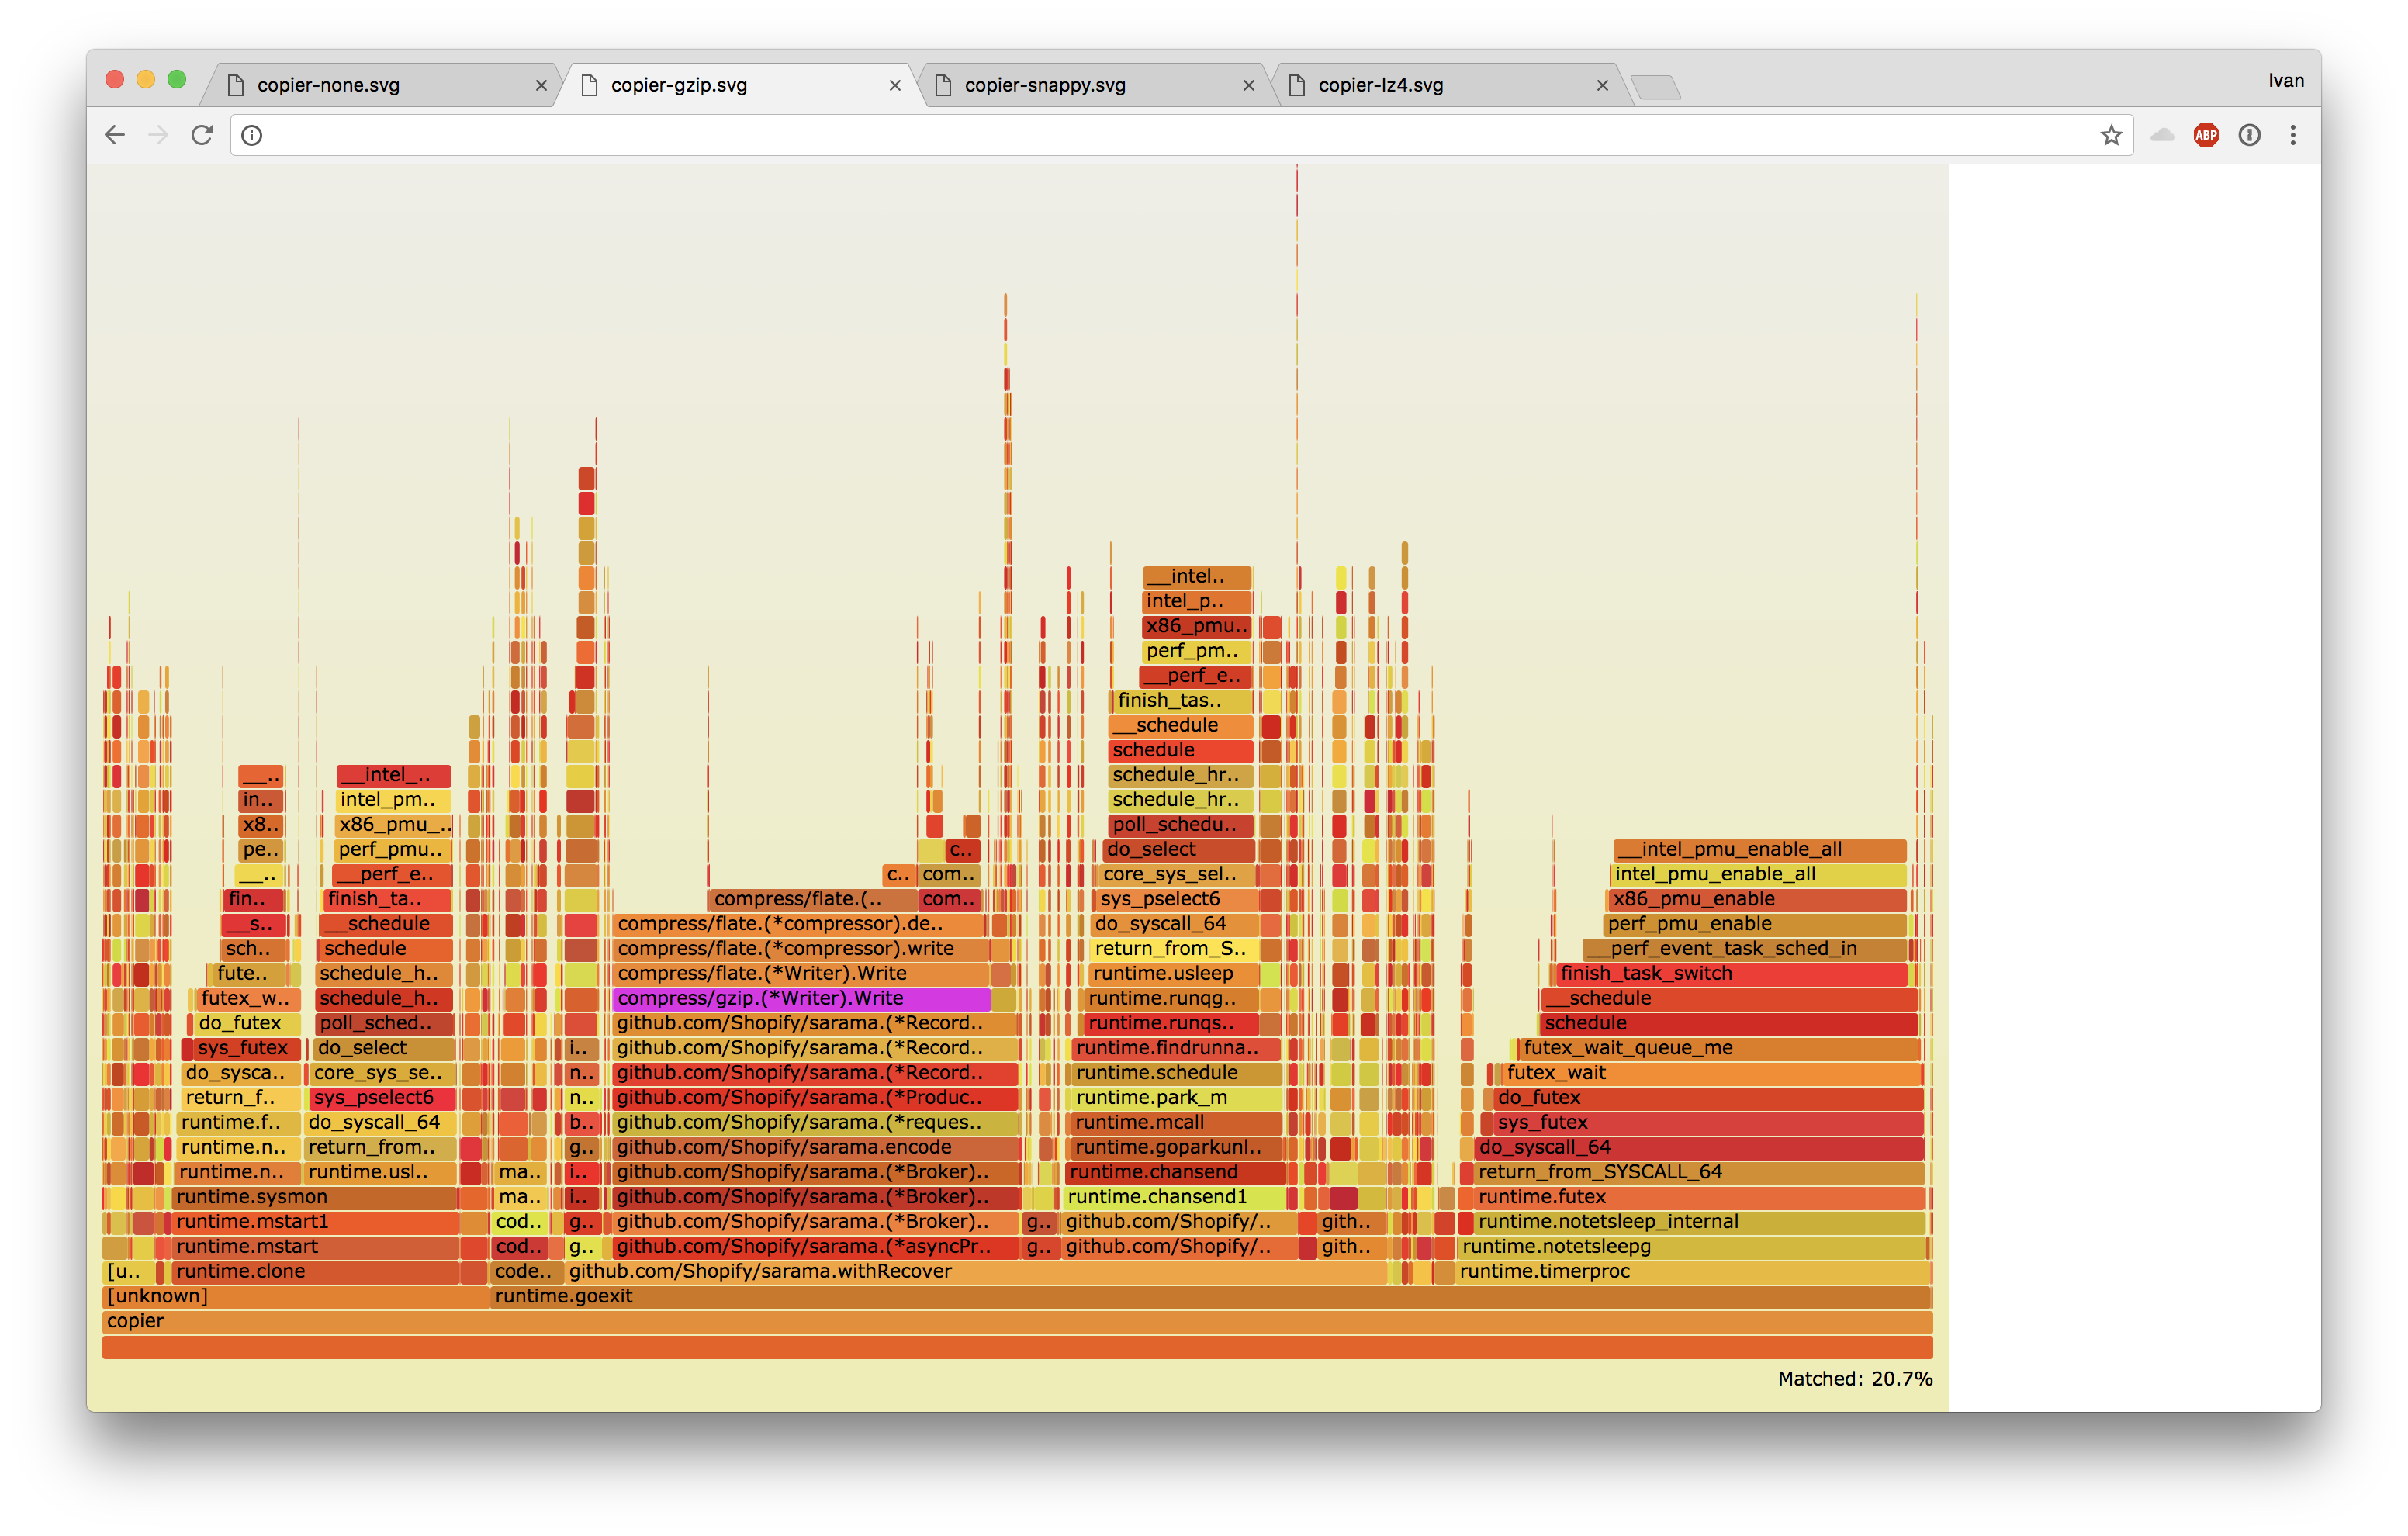
Gzip sounded too expensive from the beginning (especially in Go), but Snappy should have been able to keep up. We profiled our producer and it was spending just 2.4% of CPU time in Snappy compression, never saturating a single core:

Even gzip was spending just 20%, and it also did not saturate CPU:
It seemed that Kafka was doing something that was slowing us down. In theory, it should only decompress messages to do smoke testing, but it also has a failsafe that recompresses messages if they have invalid offsets.
For Snappy we were able to get the following thread stacktrace from Kafka with jstack:
"kafka-request-handler-3" #87 daemon prio=5 os_prio=0 tid=0x00007f80d2e97800 nid=0x1194 runnable [0x00007f7ee1adc000]
   java.lang.Thread.State: RUNNABLE
    at org.xerial.snappy.SnappyNative.rawCompress(Native Method)
    at org.xerial.snappy.Snappy.rawCompress(Snappy.java:446)
    at org.xerial.snappy.Snappy.compress(Snappy.java:119)
    at org.xerial.snappy.SnappyOutputStream.compressInput(SnappyOutputStream.java:376)
    at org.xerial.snappy.SnappyOutputStream.write(SnappyOutputStream.java:130)
    at java.io.DataOutputStream.write(DataOutputStream.java:107)
    - locked <0x00000007a74cc8f0> (a java.io.DataOutputStream)
    at org.apache.kafka.common.utils.Utils.writeTo(Utils.java:861)
    at org.apache.kafka.common.record.DefaultRecord.writeTo(DefaultRecord.java:203)
    at org.apache.kafka.common.record.MemoryRecordsBuilder.appendDefaultRecord(MemoryRecordsBuilder.java:622)
    at org.apache.kafka.common.record.MemoryRecordsBuilder.appendWithOffset(MemoryRecordsBuilder.java:409)
    at org.apache.kafka.common.record.MemoryRecordsBuilder.appendWithOffset(MemoryRecordsBuilder.java:442)
    at org.apache.kafka.common.record.MemoryRecordsBuilder.appendWithOffset(MemoryRecordsBuilder.java:595)
    at kafka.log.LogValidator$.$anonfun$buildRecordsAndAssignOffsets$1(LogValidator.scala:336)
    at kafka.log.LogValidator$.$anonfun$buildRecordsAndAssignOffsets$1$adapted(LogValidator.scala:335)
    at kafka.log.LogValidator$$$Lambda$675/1035377790.apply(Unknown Source)
    at scala.collection.mutable.ResizableArray.foreach(ResizableArray.scala:59)
    at scala.collection.mutable.ResizableArray.foreach$(ResizableArray.scala:52)
    at scala.collection.mutable.ArrayBuffer.foreach(ArrayBuffer.scala:48)
    at kafka.log.LogValidator$.buildRecordsAndAssignOffsets(LogValidator.scala:335)
    at kafka.log.LogValidator$.validateMessagesAndAssignOffsetsCompressed(LogValidator.scala:288)
    at kafka.log.LogValidator$.validateMessagesAndAssignOffsets(LogValidator.scala:71)
    at kafka.log.Log.liftedTree1$1(Log.scala:654)
    at kafka.log.Log.$anonfun$append$2(Log.scala:642)
    - locked <0x0000000640068e88> (a java.lang.Object)
    at kafka.log.Log$$Lambda$627/239353060.apply(Unknown Source)
    at kafka.log.Log.maybeHandleIOException(Log.scala:1669)
    at kafka.log.Log.append(Log.scala:624)
    at kafka.log.Log.appendAsLeader(Log.scala:597)
    at kafka.cluster.Partition.$anonfun$appendRecordsToLeader$1(Partition.scala:499)
    at kafka.cluster.Partition$$Lambda$625/1001513143.apply(Unknown Source)
    at kafka.utils.CoreUtils$.inLock(CoreUtils.scala:217)
    at kafka.utils.CoreUtils$.inReadLock(CoreUtils.scala:223)
    at kafka.cluster.Partition.appendRecordsToLeader(Partition.scala:487)
    at kafka.server.ReplicaManager.$anonfun$appendToLocalLog$2(ReplicaManager.scala:724)
    at kafka.server.ReplicaManager$$Lambda$624/2052953875.apply(Unknown Source)
    at scala.collection.TraversableLike.$anonfun$map$1(TraversableLike.scala:234)
    at scala.collection.TraversableLike$$Lambda$12/187472540.apply(Unknown Source)
    at scala.collection.mutable.HashMap.$anonfun$foreach$1(HashMap.scala:138)
    at scala.collection.mutable.HashMap$$Lambda$25/1864869682.apply(Unknown Source)
    at scala.collection.mutable.HashTable.foreachEntry(HashTable.scala:236)
    at scala.collection.mutable.HashTable.foreachEntry$(HashTable.scala:229)
    at scala.collection.mutable.HashMap.foreachEntry(HashMap.scala:40)
    at scala.collection.mutable.HashMap.foreach(HashMap.scala:138)
    at scala.collection.TraversableLike.map(TraversableLike.scala:234)
    at scala.collection.TraversableLike.map$(TraversableLike.scala:227)
    at scala.collection.AbstractTraversable.map(Traversable.scala:104)
    at kafka.server.ReplicaManager.appendToLocalLog(ReplicaManager.scala:708)
    at kafka.server.ReplicaManager.appendRecords(ReplicaManager.scala:459)
    at kafka.server.KafkaApis.handleProduceRequest(KafkaApis.scala:466)
    at kafka.server.KafkaApis.handle(KafkaApis.scala:99)
    at kafka.server.KafkaRequestHandler.run(KafkaRequestHandler.scala:65)
    at java.lang.Thread.run(Thread.java:748)
This pointed us to this piece of code in Kafka repository.
There wasn't enough logging to figure out why Kafka was recompressing, but we were able to get this information out with a patched Kafka broker:
diff --git a/core/src/main/scala/kafka/log/LogValidator.scala b/core/src/main/scala/kafka/log/LogValidator.scala
index 15750e9cd..5197d0885 100644
--- a/core/src/main/scala/kafka/log/LogValidator.scala
+++ b/core/src/main/scala/kafka/log/LogValidator.scala
@@ -21,6 +21,7 @@ import java.nio.ByteBuffer
 import kafka.common.LongRef
 import kafka.message.{CompressionCodec, NoCompressionCodec}
 import kafka.utils.Logging
+import org.apache.log4j.Logger
 import org.apache.kafka.common.errors.{InvalidTimestampException, UnsupportedForMessageFormatException}
 import org.apache.kafka.common.record._
 import org.apache.kafka.common.utils.Time
@@ -236,6 +237,7 @@ private[kafka] object LogValidator extends Logging {

       // No in place assignment situation 1 and 2
       var inPlaceAssignment = sourceCodec == targetCodec && toMagic > RecordBatch.MAGIC_VALUE_V0
+      logger.info("inPlaceAssignment = " + inPlaceAssignment + ", condition: sourceCodec (" + sourceCodec + ") == targetCodec (" + targetCodec + ") && toMagic (" + toMagic + ") > RecordBatch.MAGIC_VALUE_V0 (" + RecordBatch.MAGIC_VALUE_V0 + ")")

       var maxTimestamp = RecordBatch.NO_TIMESTAMP
       val expectedInnerOffset = new LongRef(0)
@@ -250,6 +252,7 @@ private[kafka] object LogValidator extends Logging {
         // Do not compress control records unless they are written compressed
         if (sourceCodec == NoCompressionCodec && batch.isControlBatch)
           inPlaceAssignment = true
+          logger.info("inPlaceAssignment = " + inPlaceAssignment + ", condition: sourceCodec (" + sourceCodec + ") == NoCompressionCodec (" + NoCompressionCodec + ") && batch.isControlBatch (" + batch.isControlBatch + ")")

         for (record <- batch.asScala) {
           validateRecord(batch, record, now, timestampType, timestampDiffMaxMs, compactedTopic)
@@ -261,21 +264,26 @@ private[kafka] object LogValidator extends Logging {
           if (batch.magic > RecordBatch.MAGIC_VALUE_V0 && toMagic > RecordBatch.MAGIC_VALUE_V0) {
             // Check if we need to overwrite offset
             // No in place assignment situation 3
-            if (record.offset != expectedInnerOffset.getAndIncrement())
+            val off = expectedInnerOffset.getAndIncrement()
+            if (record.offset != off)
               inPlaceAssignment = false
+              logger.info("inPlaceAssignment = " + inPlaceAssignment + ", condition: record.offset (" + record.offset + ") != expectedInnerOffset.getAndIncrement() (" + off + ")")
             if (record.timestamp > maxTimestamp)
               maxTimestamp = record.timestamp
           }

           // No in place assignment situation 4
-          if (!record.hasMagic(toMagic))
+          if (!record.hasMagic(toMagic)) {
+            logger.info("inPlaceAssignment = " + inPlaceAssignment + ", condition: !record.hasMagic(toMagic) (" + !record.hasMagic(toMagic) + ")")
             inPlaceAssignment = false
+          }

           validatedRecords += record
         }
       }

       if (!inPlaceAssignment) {
+        logger.info("inPlaceAssignment = " + inPlaceAssignment + "; recompressing")
         val (producerId, producerEpoch, sequence, isTransactional) = {
           // note that we only reassign offsets for requests coming straight from a producer. For records with magic V2,
           // there should be exactly one RecordBatch per request, so the following is all we need to do. For Records
And the output was:
Dec 29 23:18:59 mybroker kafka[33461]: INFO inPlaceAssignment = true, condition: sourceCodec (SnappyCompressionCodec) == targetCodec (SnappyCompressionCodec) && toMagic (2) > RecordBatch.MAGIC_VALUE_V0 (0) (kafka.log.LogValidator$)
Dec 29 23:18:59 mybroker kafka[33461]: INFO inPlaceAssignment = true, condition: sourceCodec (SnappyCompressionCodec) == NoCompressionCodec (NoCompressionCodec) && batch.isControlBatch (false) (kafka.log.LogValidator$)
Dec 29 23:18:59 mybroker kafka[33461]: INFO inPlaceAssignment = true, condition: record.offset (0) != expectedInnerOffset.getAndIncrement() (0) (kafka.log.LogValidator$)
Dec 29 23:18:59 mybroker kafka[33461]: INFO inPlaceAssignment = false, condition: record.offset (0) != expectedInnerOffset.getAndIncrement() (1) (kafka.log.LogValidator$)
Dec 29 23:18:59 mybroker kafka[33461]: INFO inPlaceAssignment = false, condition: record.offset (0) != expectedInnerOffset.getAndIncrement() (2) (kafka.log.LogValidator$)
Dec 29 23:18:59 mybroker kafka[33461]: INFO inPlaceAssignment = false, condition: record.offset (0) != expectedInnerOffset.getAndIncrement() (3) (kafka.log.LogValidator$)
Dec 29 23:18:59 mybroker kafka[33461]: INFO inPlaceAssignment = false, condition: record.offset (0) != expectedInnerOffset.getAndIncrement() (4) (kafka.log.LogValidator$)
Dec 29 23:18:59 mybroker kafka[33461]: INFO inPlaceAssignment = false, condition: record.offset (0) != expectedInnerOffset.getAndIncrement() (5) (kafka.log.LogValidator$)
Dec 29 23:18:59 mybroker kafka[33461]: INFO inPlaceAssignment = false, condition: record.offset (0) != expectedInnerOffset.getAndIncrement() (6) (kafka.log.LogValidator$)
We promptly fixed the issue and resumed the testing. These were the results:
| Compression | User time | Messages | Time per 1m | CPU ratio | Disk usage | Avg message size | Compression ratio |
|---|---|---|---|---|---|---|---|
| None | 209.67s | 26.00M | 8.06s | 1x | 41448MB | 1594B | 1x |
| Gzip | 570.56s | 6.98M | 81.74s | 10.14x | 3111MB | 445B | 3.58x |
| Snappy | 337.55s | 26.02M | 12.97s | 1.61x | 17675MB | 679B | 2.35x |
| LZ4 | 525.82s | 26.01M | 20.22s | 2.51x | 22922MB | 881B | 1.81x |
Now we were able to keep up with both Snappy and LZ4. Gzip was still out of the question and LZ4 had incompatibility issues between Kafka versions and our Go client, which left us with Snappy. This was a winner in terms of compression ratio and speed too, so we were not very disappointed by the lack of choice.
Deploying into production
In production we started small with Java based consumers and producers. Our first production topic was just 1Mbps and 600rps of nginx error logs. Messages there were very repetitive and we were able to get whopping 8x decrease in size with batching records for just 1 second across 2 partitions.
This gave us some confidence to move onto next topic with journald logs encoded with JSON. Here we were able to reduce ingress from 300Mbps to just 50Mbps (yellow line on the graph):

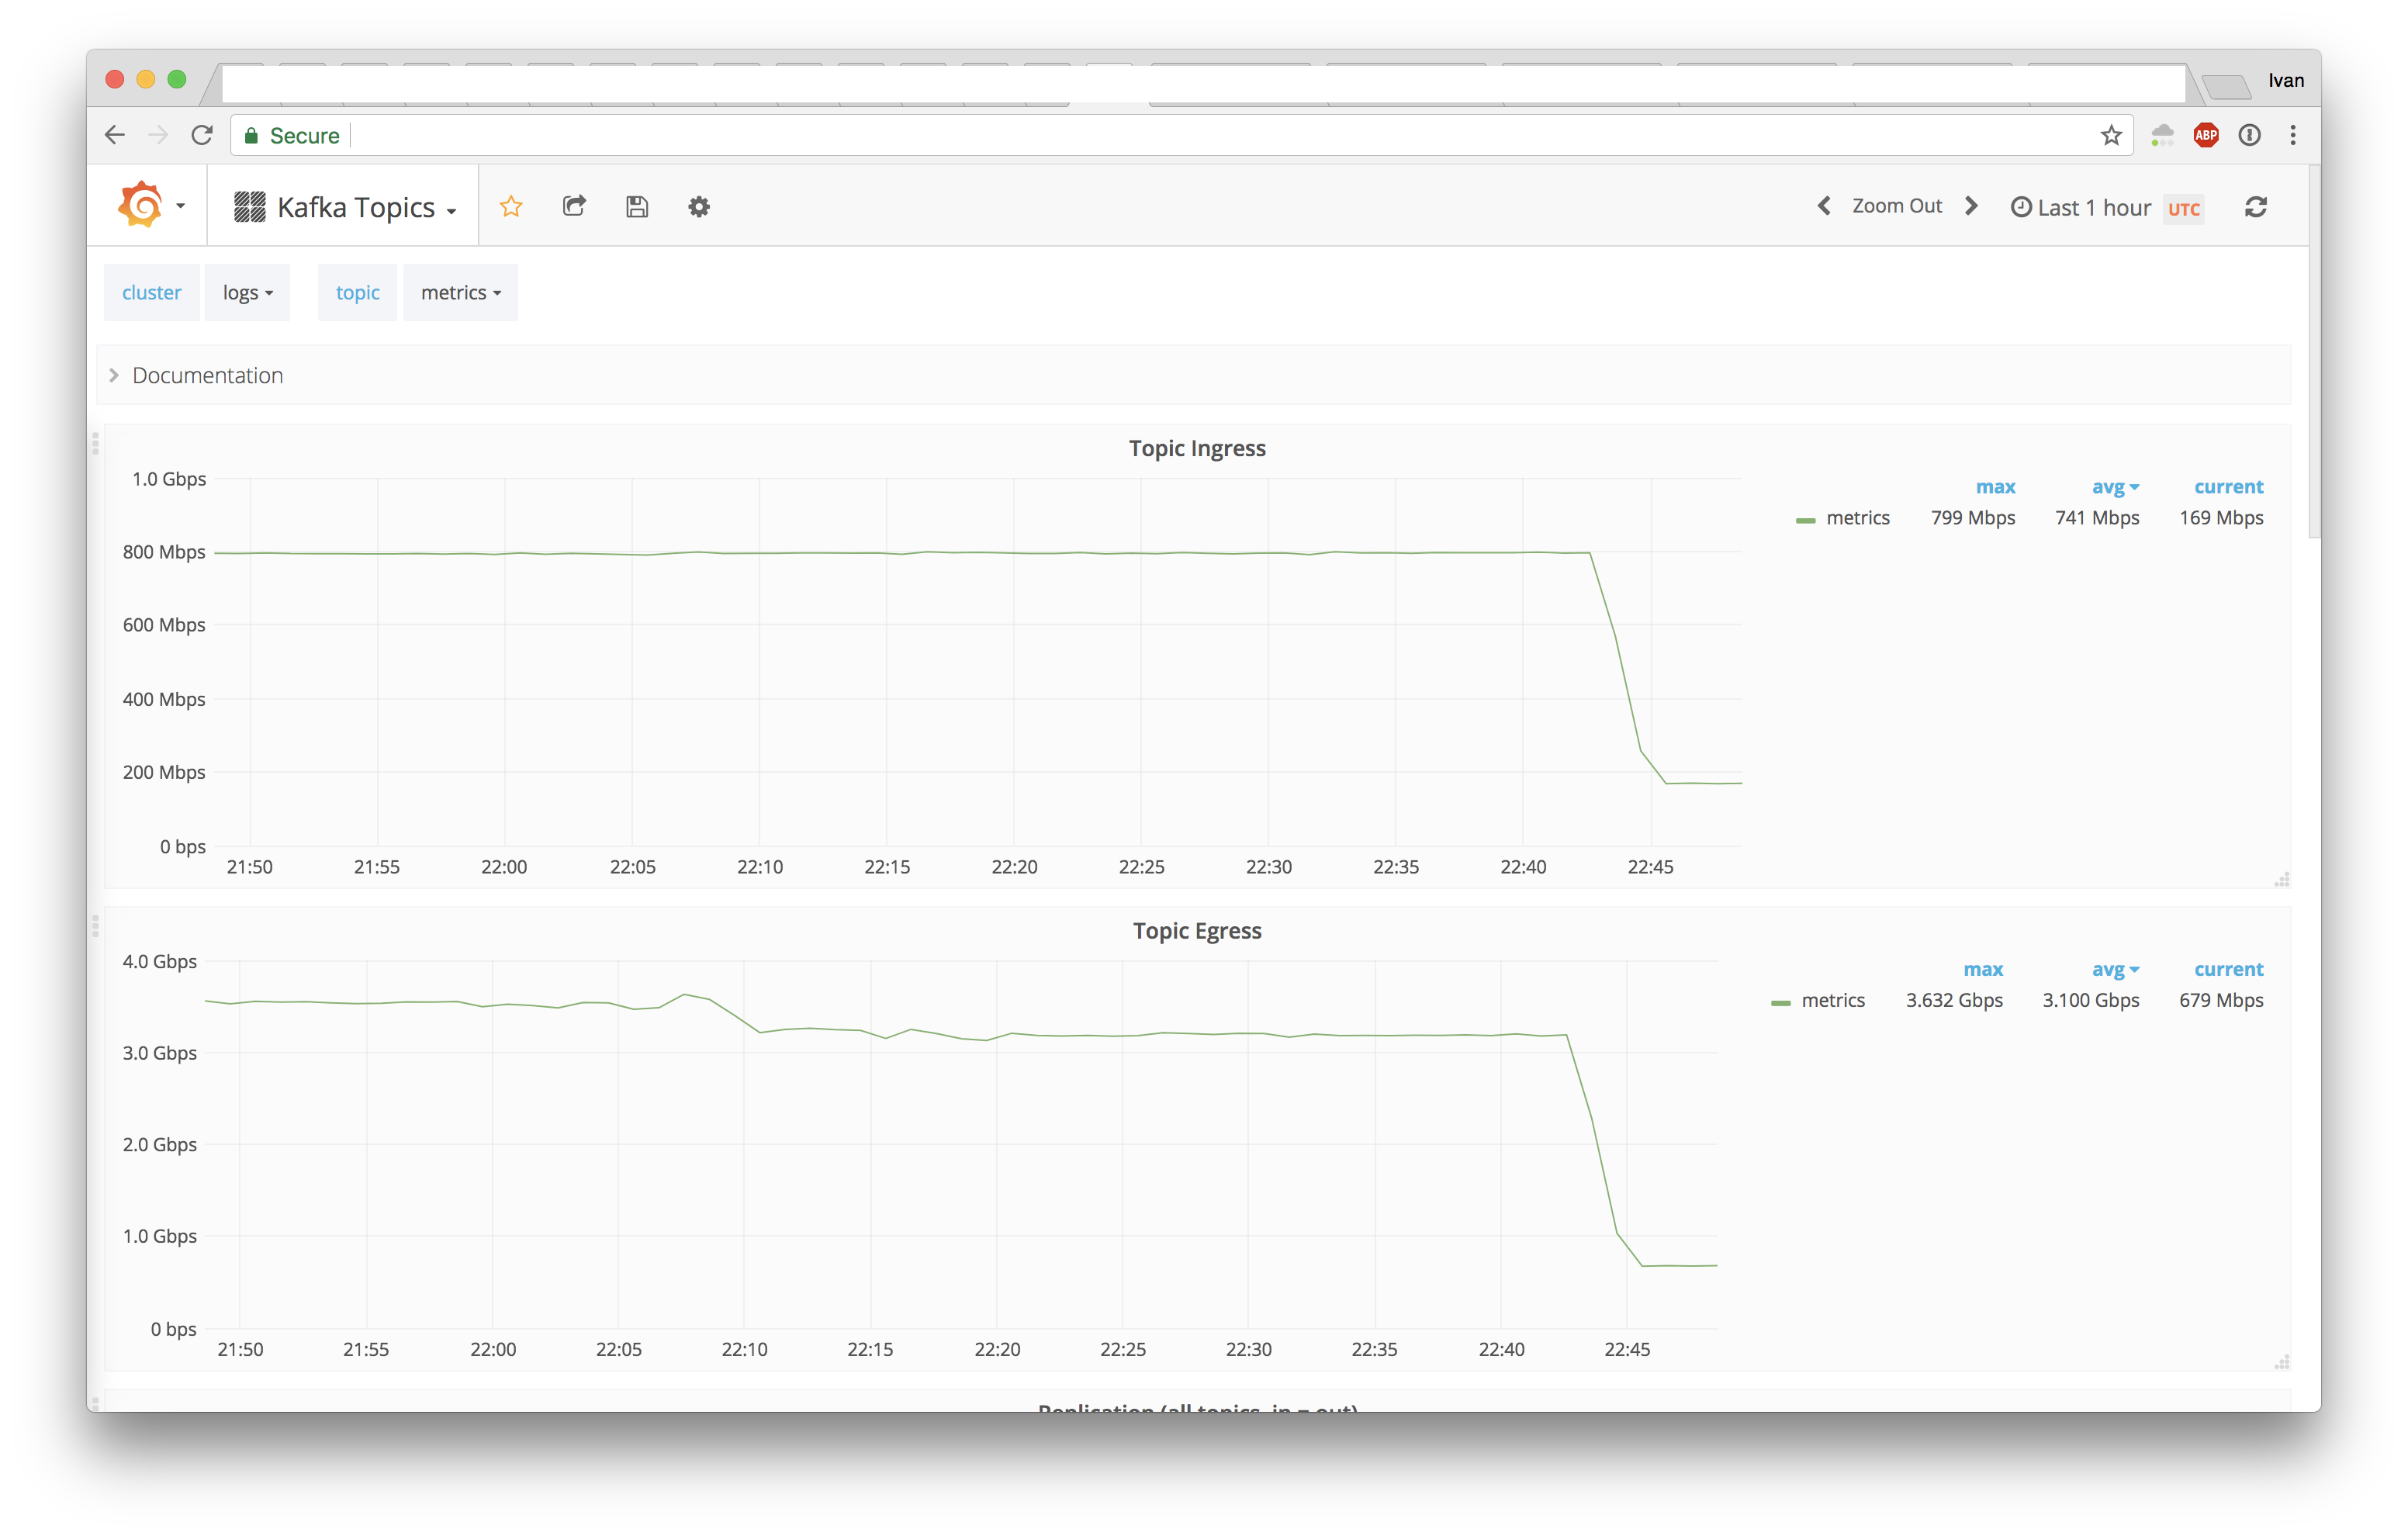
At that point we were switched to our own Go consumers and decreased metrics Kafka topic from 800Mbps to just 170Mpbs, lowering average message size 5x from 150B to just 30B.

Next stop was DNS logs with 3.5Gbps and 1.5Mrps baseline (attacks can make it go 3x that). Here wins were a lot smaller: just 2.6x lower average message size.

While it sounds not as exciting as previous size reductions, keep in mind that these are capnp messages, which means there's not much repetition in field names, only in values. As an added bonus, Kafka broker CPU and GC also went down in DNS cluster:


With all major topics in DNS cluster switched to Snappy we saw even better picture in terms of broker CPU usage:


On the next graph you can see Kafka CPU usage as the purple line and producer CPU usage as the green line:

CPU usage of the producer did not go up substantially, which means most of the work is spend in non compression related tasks. Consumers did not see any increase in CPU usage either, which means we've got our 2.6x decrease in size practically for free.
It was time to hunt the biggest beast of all: requests topic with HTTP access logs. There we were doing up to 100Gbps and 7.5Mrps of ingress at peak (a lot more when big attacks are happening, but this was a quiet week):
 **
**
With many smaller topics switched to Snappy already, we did not need to do anything special here. This is how it went:


That's a 2.25x decrease in ingress bandwidth and average message size. We have multiple replicas and consumers, which means egress is a multiple of ingress. We were able to reduce in-DC traffic by hundreds of gigabits of internal traffic and save terabytes of flash storage. With network and disks being bottlenecks, this meant we'd need less than a half of hardware we had. Kafka was one the the main hardware hogs in this datacenter, so this was a large scale win.
Yet, 2.25x seemed a bit on the low side.
Looking for more
We wanted to see if we can do better. To do that, we extracted one batch of records from Kafka and ran some benchmarks on it. All batches are around 1MB uncompressed, 600 records in each on average.
To run the benchmarks we used lzbench, which runs lots of different compression algorithms and provides a summary. Here's what we saw with results sorted by compression ratio (heavily filtered list):
lzbench 1.7.3 (64-bit MacOS)   Assembled by P.Skibinski
Compressor name         Compress. Decompress. Compr. size  Ratio Filename
memcpy                  33587 MB/s 33595 MB/s      984156 100.00
...
lz4 1.8.0                 594 MB/s  2428 MB/s      400577  40.70
...
snappy 1.1.4              446 MB/s  1344 MB/s      425564  43.24
...
zstd 1.3.3 -1             409 MB/s   844 MB/s      259438  26.36
zstd 1.3.3 -2             303 MB/s   889 MB/s      244650  24.86
zstd 1.3.3 -3             242 MB/s   899 MB/s      232057  23.58
zstd 1.3.3 -4             240 MB/s   910 MB/s      230936  23.47
zstd 1.3.3 -5             154 MB/s   891 MB/s      226798  23.04
This looked too good to be true. Zstandard is a fairly new (released 1.5 years ago) compression algorithm from Facebook. In benchmarks on the project's home page you can see this:
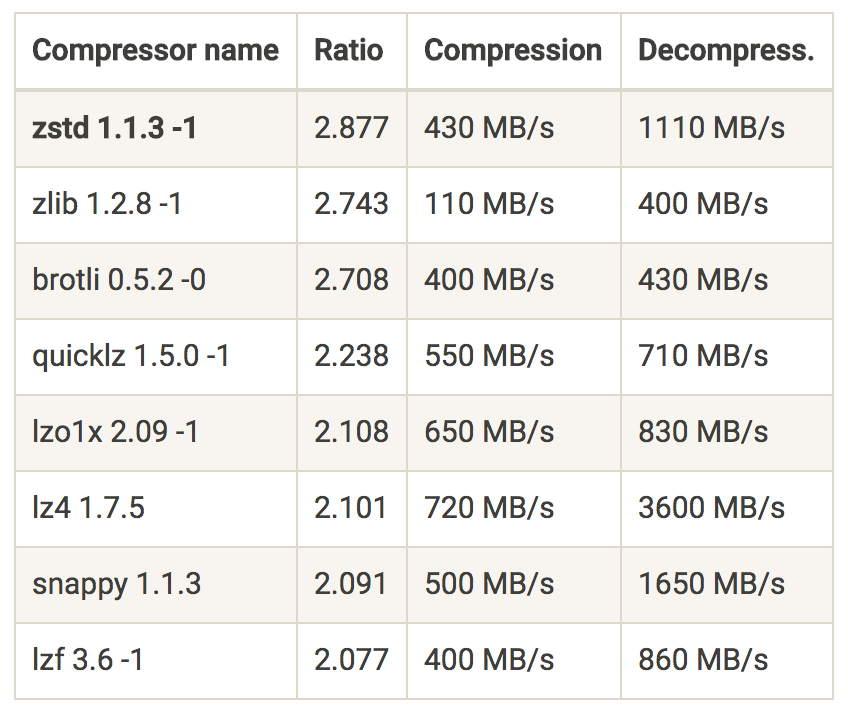
In our case we were getting this:
| Compressor name | Ratio | Compression | Decompression |
|---|---|---|---|
| zstd | 3.794 | 409 MB/s | 844 MB/s |
| lz4 | 2.475 | 594 MB/s | 2428 MB/s |
| snappy | 2.313 | 446 MB/s | 1344 MB/s |
Clearly, results are very dependent on the kind of data you are trying to compress. For our data zstd was giving amazing results even on the lowest compression level. Compression ratio was better than even gzip at maximum compression level, while throughput was a lot higher. For posterity, this is how DNS logs compressed (HTTP logs compressed similarly):
$ ./lzbench -ezstd/zlib rrdns.recordbatch
lzbench 1.7.3 (64-bit MacOS)   Assembled by P.Skibinski
Compressor name         Compress. Decompress. Compr. size  Ratio Filename
memcpy                  33235 MB/s 33502 MB/s      927048 100.00 rrdns.recordbatch
zstd 1.3.3 -1             430 MB/s   909 MB/s      226298  24.41 rrdns.recordbatch
zstd 1.3.3 -2             322 MB/s   878 MB/s      227271  24.52 rrdns.recordbatch
zstd 1.3.3 -3             255 MB/s   883 MB/s      217730  23.49 rrdns.recordbatch
zstd 1.3.3 -4             253 MB/s   883 MB/s      217141  23.42 rrdns.recordbatch
zstd 1.3.3 -5             169 MB/s   869 MB/s      216119  23.31 rrdns.recordbatch
zstd 1.3.3 -6             102 MB/s   939 MB/s      211092  22.77 rrdns.recordbatch
zstd 1.3.3 -7              78 MB/s   968 MB/s      208710  22.51 rrdns.recordbatch
zstd 1.3.3 -8              65 MB/s  1005 MB/s      204370  22.05 rrdns.recordbatch
zstd 1.3.3 -9              59 MB/s  1008 MB/s      204071  22.01 rrdns.recordbatch
zstd 1.3.3 -10             44 MB/s  1029 MB/s      202587  21.85 rrdns.recordbatch
zstd 1.3.3 -11             43 MB/s  1054 MB/s      202447  21.84 rrdns.recordbatch
zstd 1.3.3 -12             32 MB/s  1051 MB/s      201190  21.70 rrdns.recordbatch
zstd 1.3.3 -13             31 MB/s  1050 MB/s      201190  21.70 rrdns.recordbatch
zstd 1.3.3 -14             13 MB/s  1074 MB/s      200228  21.60 rrdns.recordbatch
zstd 1.3.3 -15           8.15 MB/s  1171 MB/s      197114  21.26 rrdns.recordbatch
zstd 1.3.3 -16           5.96 MB/s  1051 MB/s      190683  20.57 rrdns.recordbatch
zstd 1.3.3 -17           5.64 MB/s  1057 MB/s      191227  20.63 rrdns.recordbatch
zstd 1.3.3 -18           4.45 MB/s  1166 MB/s      187967  20.28 rrdns.recordbatch
zstd 1.3.3 -19           4.40 MB/s  1108 MB/s      186770  20.15 rrdns.recordbatch
zstd 1.3.3 -20           3.19 MB/s  1124 MB/s      186721  20.14 rrdns.recordbatch
zstd 1.3.3 -21           3.06 MB/s  1125 MB/s      186710  20.14 rrdns.recordbatch
zstd 1.3.3 -22           3.01 MB/s  1125 MB/s      186710  20.14 rrdns.recordbatch
zlib 1.2.11 -1             97 MB/s   301 MB/s      305992  33.01 rrdns.recordbatch
zlib 1.2.11 -2             93 MB/s   327 MB/s      284784  30.72 rrdns.recordbatch
zlib 1.2.11 -3             74 MB/s   364 MB/s      265415  28.63 rrdns.recordbatch
zlib 1.2.11 -4             68 MB/s   342 MB/s      269831  29.11 rrdns.recordbatch
zlib 1.2.11 -5             48 MB/s   367 MB/s      258558  27.89 rrdns.recordbatch
zlib 1.2.11 -6             32 MB/s   376 MB/s      247560  26.70 rrdns.recordbatch
zlib 1.2.11 -7             24 MB/s   409 MB/s      244623  26.39 rrdns.recordbatch
zlib 1.2.11 -8           9.67 MB/s   429 MB/s      239659  25.85 rrdns.recordbatch
zlib 1.2.11 -9           3.63 MB/s   446 MB/s      235604  25.41 rrdns.recordbatch
For our purposes we picked level 6 as the compromise between compression ratio and CPU cost. It is possible to be even more aggressive as real world usage proved later.
One great property of zstd is more or less the same decompression speed between levels, which means you only have one knob that connects CPU cost of compression to compression ratio.
Armed with this knowledge, we dug up forgotten Kafka ticket to add zstd, along with KIP (Kafka Improvement Proposal) and even PR on Github. Sadly, these did not get traction back in the day, but this work saved us a lot of time.
We ported the patch to Kafka 1.0.0 release and pushed it in production. After another round of smaller scale testing and with patched clients we pushed Zstd into production for requests topic.
Graphs below include switch from no compression (before 2/9) to Snappy (2/9 to 2/17) to Zstandard (after 2/17):


The decrease in size was 4.5x compared to no compression at all. On next generation hardware with 2.4x more storage and 2.5x higher network throughput we suddenly made our bottleneck more than 10x wider and shifted it from storage and network to CPU cost. We even got to cancel pending hardware order for Kafka expansion because of this.
Conclusion
Zstandard is a great modern compression algorighm, promising high compression ratio and throughput, tunable in small increments. Whenever you consider using compression, you should check zstd. If you don't consider compression, then it's worth seeing if you can get benefits from it. Run benchmarks with your data in either case.
Testing in real world scenario showed how benchmarks, even coming from zstd itself, can be misleading. Going beyond codecs built into Kafka allowed us to improve compression ratio 2x at very low cost.
We hope that the data we gathered can be a catalyst to making Zstandard an official compression codec in Kafka to benefit other people. There are 3 bits allocated for codec type and only 2 are used so far, which means there are 4 more vacant places.
If you were skeptical of compression benefits in Kafka because of old flaws in Kafka protocol, this may be the time to reconsider.
If you enjoy benchmarking, profiling and optimizing large scale services, come join us.