Configuring user defined metrics
TLDR: Configure collecting of new metrics based on user YAML configuration.
pgSCV has a lot of builtin metrics, but sometimes user needs to collect extra metrics specific to its infrastructure or business requirements. In addition to builtin metrics, it is possible to collect user-defined metrics.
pgSCV has limited support of user-defined metrics:
- SQL queries based metrics
Here is example of YAML configuration for collecting user-defined metric.
collectors:
  postgres/custom:
    subsystems:
      table:
        databases: "pgbench"
        query: "select schemaname,relname,seq_scan,n_tup_ins,n_tup_upd,n_tup_del from pg_stat_user_tables"
        metrics:
          - name: seq_scan
            usage: COUNTER
            value: seq_scan
            labels:
              - schemaname
              - relname
            description: "Total number of tuples by operation."
          - name: tuples_total
            usage: COUNTER
            labeled_values:
              tuples: [ n_tup_ins, n_tup_upd, n_tup_del ]
            labels:
              - schemaname
              - relname
            description: "Total number of tuples by operation."
Now describe all statements and their role in configuration.
-
collectors- all user metrics are defined in collectors settings. -
postgres/custom- this is the special builtin collector used only for user metrics. All metric collected bypostgres/customcollector haspostgresas first part of metric FQN. -
subsystems- defines dictionary (map) of metrics subsystems, which unions set of metrics using common specific. -
table- this is particular subsystem which union metrics related to tables. Each subsystem is a second part of metric name FQN. When define new metrics, user have to define its own subsystems. -
databases- regular expression contains databases where metrics should be collected. Empty value tells collect metric only once in first connected database. For specifying all databases use.+regexp. -
query- SQL query used for getting data (values and labels) for metrics. Note, all defined metrics relies on column names and aliases when looking for values and labels. -
metrics- list of metrics which collected from data returned byquery. -
name- name of the metric - this is the last, third part of metric FQN. -
usage- define type of metric - supported onlyGAUGEandCOUNTERtypes. -
value- name of the column (or alias) from SQL query, which contains metric value. -
labeled_values- dictionary of label name with list of column names (or aliases) which contains metric values. - It is important:
valueandlabeled_valuescan't be used together. -
labels- list of column names (or aliases) from SQL query which contain label values. -
description- metric description.
Notes:
- User-defined metrics allowed only in
postgres/customcollector. All other collectors ignoresubsystemssettings. - Avoid using user-defined metrics with the same names as builtin metrics. These collisions are untracked and lead to duplicate errors during metrics update. In case of such collisions, errors are reported to the stdout.
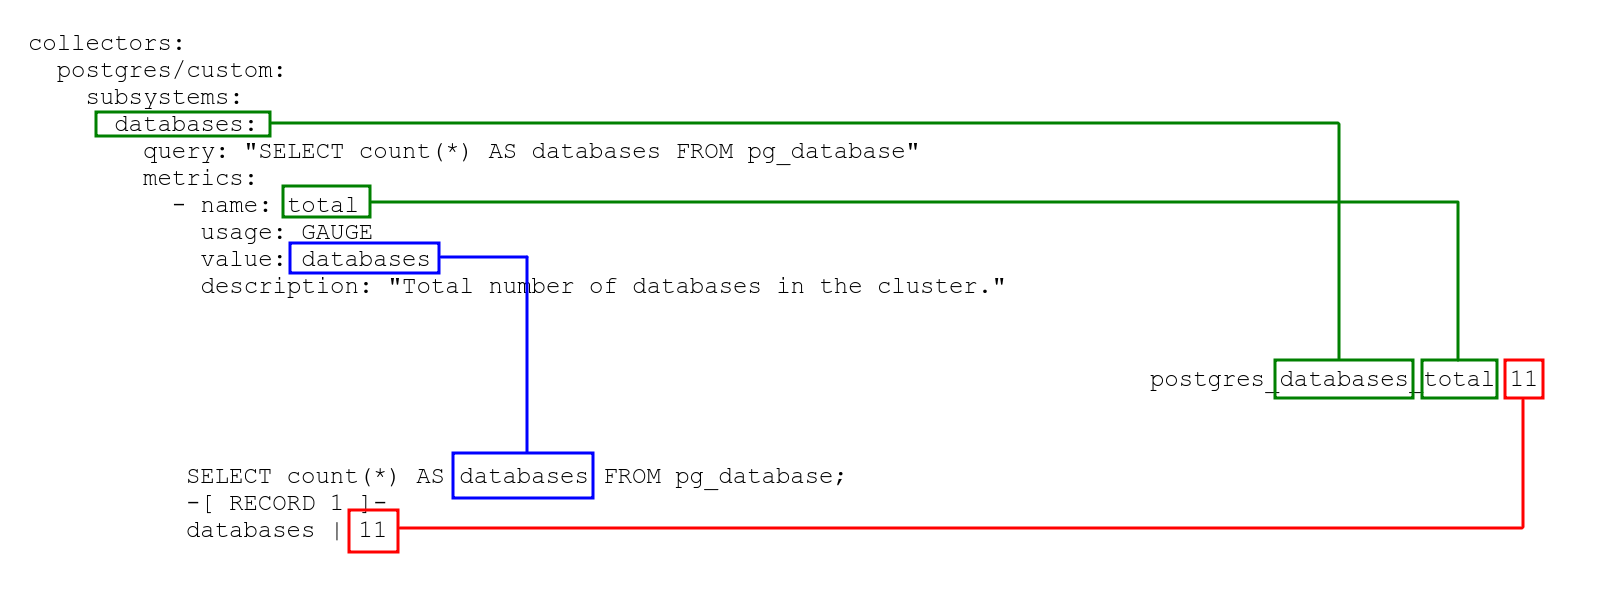
In this example, count number of databases in the cluster.
Total number of databases could be retrieved with the following query:
# SELECT count(*) AS databases FROM pg_database;
 databases
-----------
        11
Define the metric using the following YAML configuration:
collectors:
  postgres/custom:
    subsystems:
      databases:
        query: "SELECT count(*) AS databases FROM pg_database"
        metrics:
          - name: total
            usage: GAUGE
            value: databases
            description: "Total number of databases in the cluster."
The resulting metric is:
# HELP postgres_databases_total Total number of databases in the cluster.
# TYPE postgres_databases_total gauge
postgres_databases_total 11
The diagram shows how YAML configuration, SQL data and metric are connected to each other.
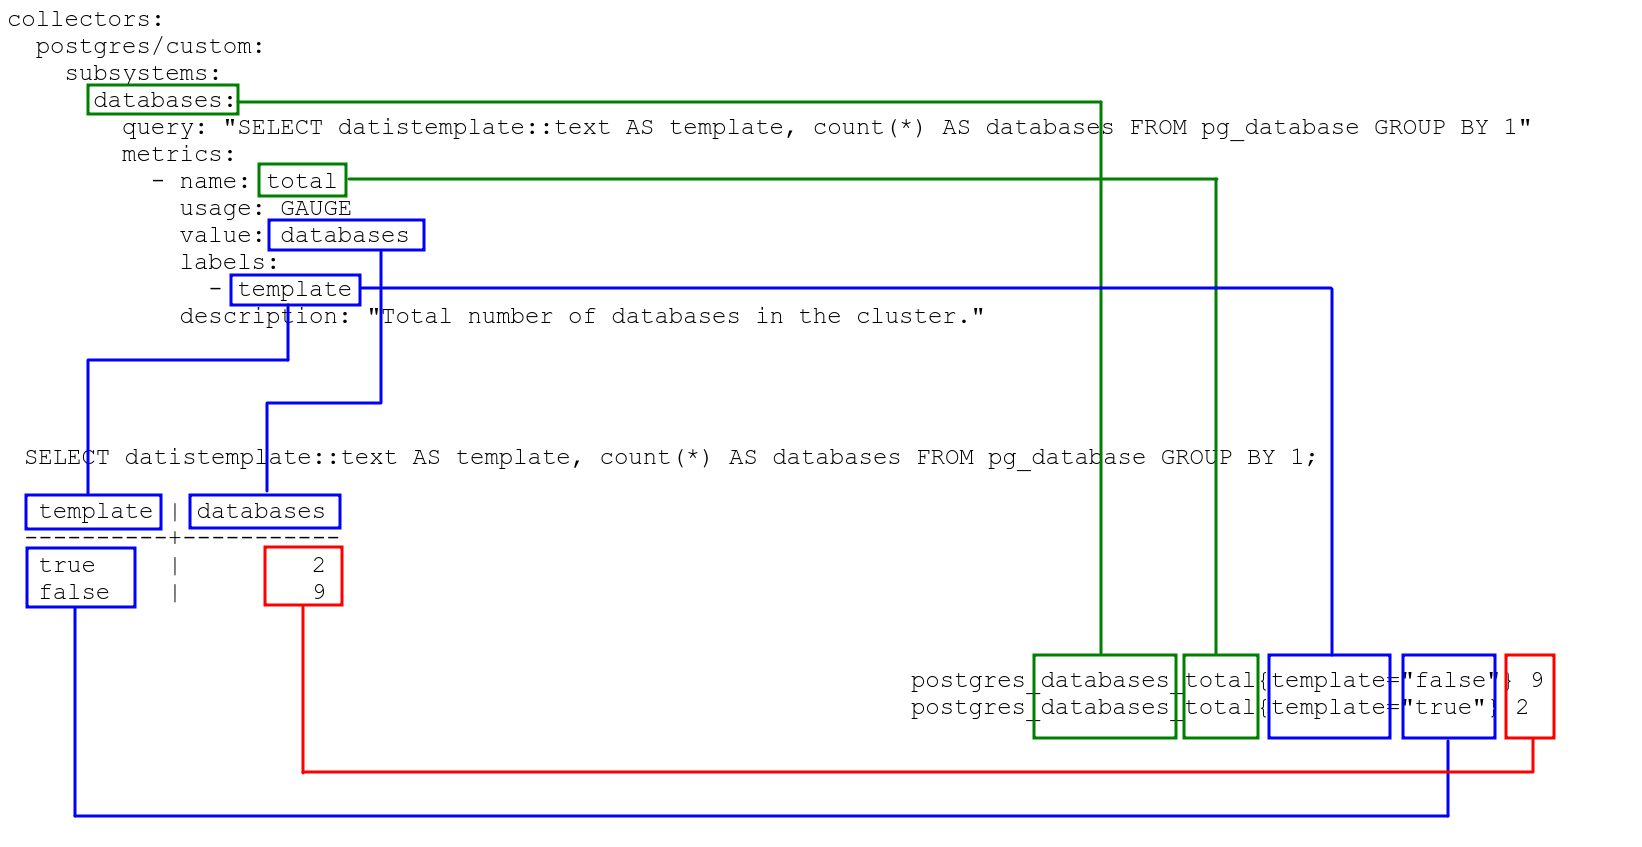
In this example, count number of databases with extra property attached as a label.
Use the following query:
-
databasescolumn contains values for metric itself -
templatecolumn contains values fortemplatelabel
select datistemplate::text as template,count(*) as databases from pg_database group by 1;
 template | databases
----------+-----------
 true     |         2
 false    |         9
Define the metric using the following YAML configuration:
collectors:
  postgres/custom:
    subsystems:
      databases:
        query: "select datistemplate::text as template,count(*) as databases from pg_database group by 1"
        metrics:
          - name: total
            usage: GAUGE
            value: databases
            labels:
              - template
            description: "Total number of databases in the cluster."
Resulting metric is:
# HELP postgres_databases_total Total number of databases in the cluster.
# TYPE postgres_databases_total gauge
postgres_databases_total{template="false"} 9
postgres_databases_total{template="true"} 2
The diagram shows how YAML configuration, SQL data and metric are connected to each other.
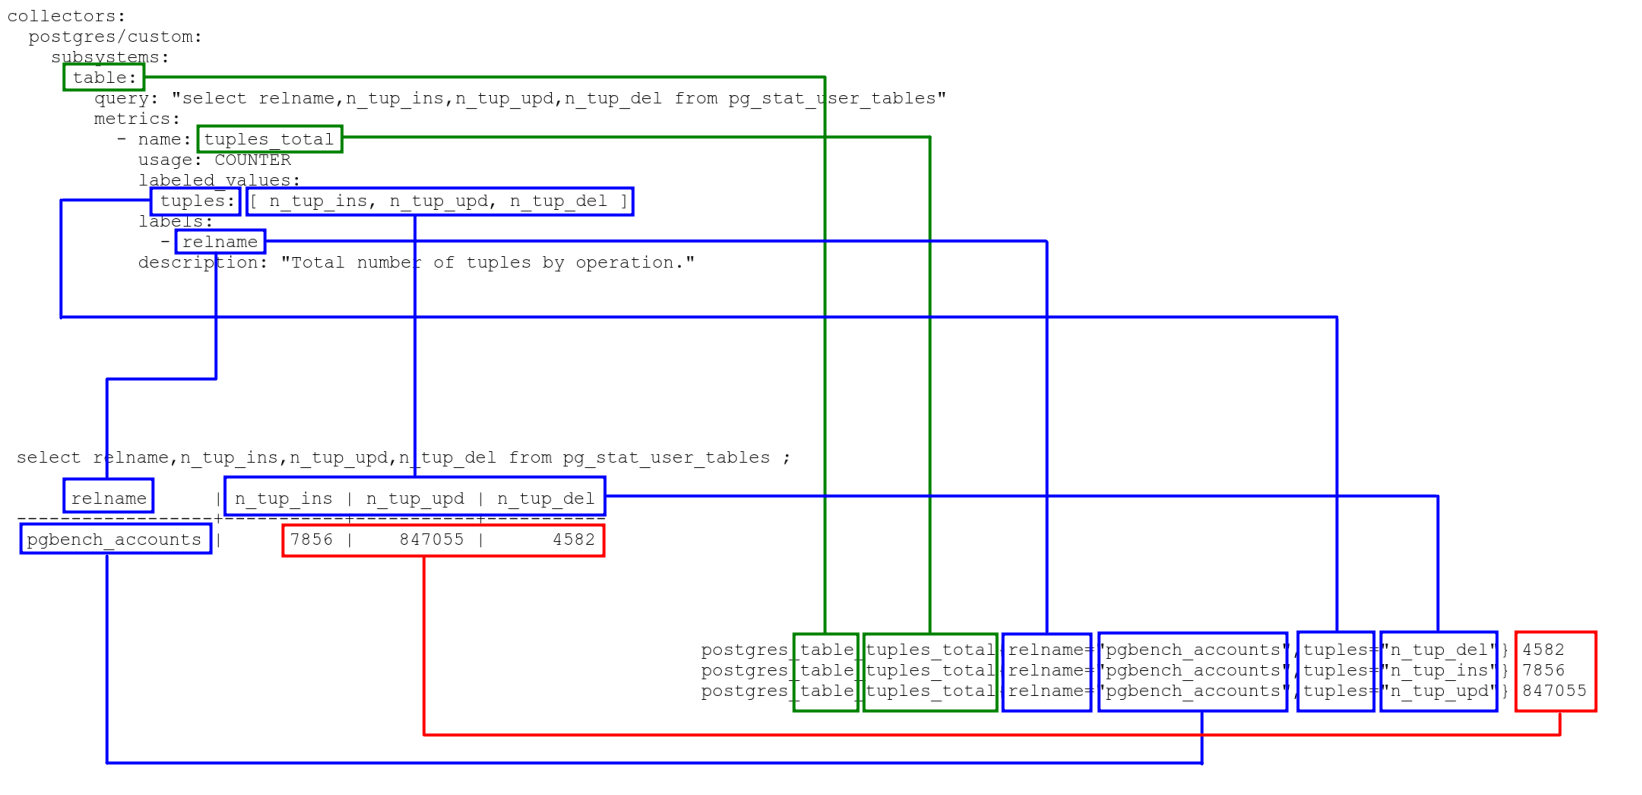
In this example we have a query with columns which names should be used as label values, and columns' values should be used as metric values.
select relname,n_tup_ins,n_tup_upd,n_tup_del from pg_stat_user_tables ;
     relname      | n_tup_ins | n_tup_upd | n_tup_del
------------------+-----------+-----------+-----------
 pgbench_accounts |      7856 |    847055 |      4582
Define metric using the following YAML configuration:
collectors:
  postgres/custom:
    subsystems:
      table:
        query: "select relname,n_tup_ins,n_tup_upd,n_tup_del from pg_stat_user_tables"
        metrics:
          - name: tuples_total
            usage: COUNTER
            labeled_values:
              tuples: [ n_tup_ins, n_tup_upd, n_tup_del ]
            labels:
              - relname
            description: "Total number of tuples by operation."
The resulting metric is:
# HELP postgres_table_tuples_total Total number of tuples by operation.
# TYPE postgres_table_tuples_total counter
postgres_table_tuples_total{relname="pgbench_accounts",tuples="n_tup_del"} 4582
postgres_table_tuples_total{relname="pgbench_accounts",tuples="n_tup_ins"} 7856
postgres_table_tuples_total{relname="pgbench_accounts",tuples="n_tup_upd"} 847055
The diagram shows how YAML configuration, SQL data and metric are connected to each other.