Apache ECharts graduated from the Apache Incubator to become a top-level Apache project, which means that the project’s community and products have been well-governed under the Apache Software Foundation’s meritocratic process and principles.
ECharts, which recently reached version 5, is a charting and visualization library that is best suited for commercial-grade presentations, according to the ASF.
The project is written in JavaScript and is based on the ZRender rendering engine that supports Canvas and SVG.
“With Apache ECharts, developers around the world have access to a powerful, free and open source library for data visualization. It is great to see the project flourishing on GitHub. Congrats to the Apache ECharts on their graduation to a top level project at the Apache Software Foundation,” said Erica Brescia, the COO of GitHub.
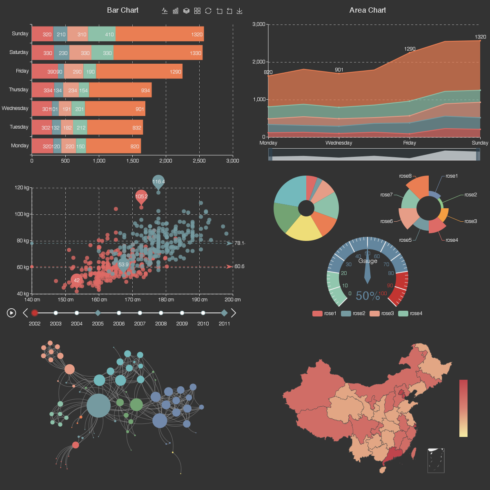
Users have access to customizable chart types that span line, column, scatter, pie, radar, candlestick, gauge, funnel, heatmap, and more.
In addition, Apache ECharts features multi-dimensional data analysis and coding, out-of-the-box interactive components, and extensions for 3-D visualization and other rich special effects as well as Python, R, Julia, and other languages.