

When monitoring third-party applications with Prometheus, you’ll need an exporter if the application doesn’t already expose metrics in the appropriate format. How do you find an appropriate exporter, and once you have your exporters, how should you organize your label taxonomies to reflect your infrastructure?
Many applications in the systems you’re in charge of will be third-party applications, which do not natively expose Prometheus-formatted metrics. For example, Linux does not expose Prometheus-formatted metrics. However, you can download and run the node exporter to expose hundreds of machine-level metrics.
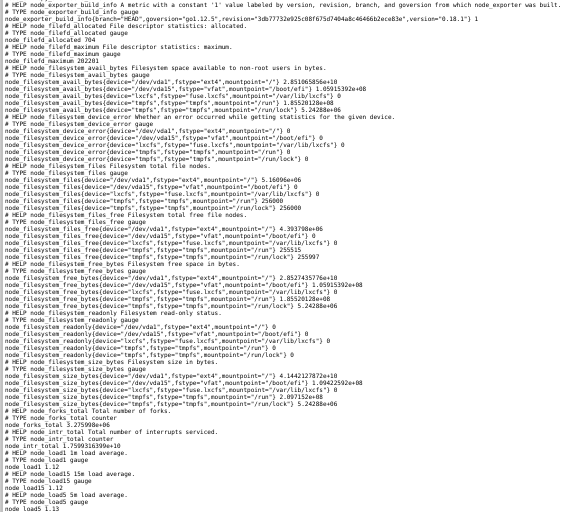
Once you have the node exporter running locally on your machine, it’s easy to run Prometheus to scrape it with a simple configuration, like:
global:
  scrape_interval: 5s   # Reduced for demo sake
scrape_configs:
  - job_name: node
    static_configs:
      - targets: ['localhost:9100']
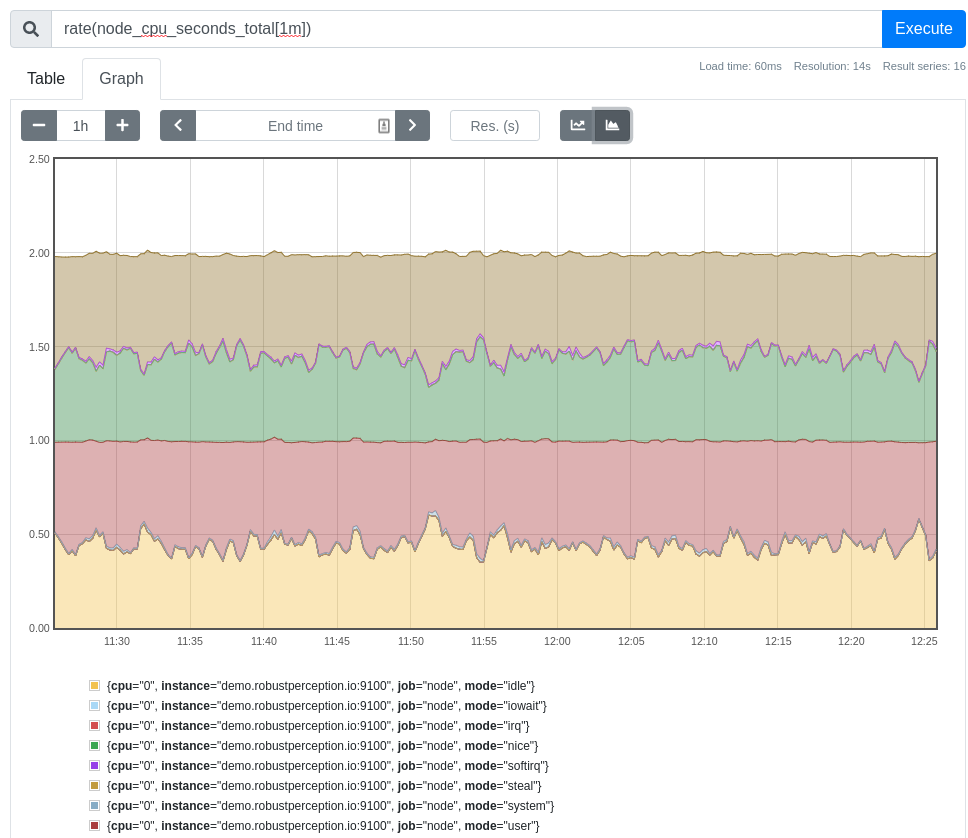
Once Prometheus is running, you can use PromQL queries to see how the metrics are evolving over time, such as rate(node_cpu_seconds_total[1m]) to observe CPU usage:
While the node exporter does a great job of producing machine-level metrics on Unix systems, it’s not going to help you expose metrics for all of your other third-party applications. For that, you need to obtain an exporter for each of those applications.
There are literally hundreds of exporters out there, for all sorts of applications. There are even some applications for which many exporters have been developed by different people. So how do you find an exporter for a given application, and how do you evaluate it?
Your first stop should be the Exporters and Integrations page on the main Prometheus website. If your application or the protocol it provides metrics over is listed, then that exporter is probably a good choice. There are also third-party listings of exporters, such as promcat.io maintained by Sysdig. Additionally, you could look at the Default port allocations page, which inadvertently ended up as a fairly comprehensive listing of exporters. Finally, you could use your favorite search engine, the query “myapplication Prometheus exporter” tends to work. While it may be the case that no exporter exists and you’ll have to write one, that’s pretty rare these days.
If you find multiple exporters though, you’re left with the problem of which one to use. Many aspects of metric and exporter best practices are not obvious at first glance, so relying on existing curated lists can help find ones that are likely to work well into the future. You could also see how well each candidate exporter provides the metrics you’re interested in, and how healthy the exporter is as a software project. For example, an exporter that was developed years ago by one person, with no recent updates and a low number of PRs/issues/Github stars, is likely unused and unmaintained. On the other hand, a thriving community tends to be a good sign. Keep in mind that just because an exporter hasn’t had recent code changes, doesn’t mean that it’s to be avoided. For many applications, it’s not hard to get an exporter to the point where it is feature complete and thus requires little ongoing maintenance.
Let’s say that you were running the HAProxy, so you deployed the haproxy_exporter on the machines using it, plus the node exporter on all of the machines as well. Your Prometheus config might look like:
global:
  scrape_interval: 5s   # Reduced for demo sake
scrape_configs:
  - job_name: node
    static_configs:
      - targets:
        - '192.168.1.1:9100'
        - '192.168.1.2:9100'
        - '192.168.1.3:9100'
        - '192.168.1.4:9100'
  - job_name: haproxy
    static_configs:
      - targets:
        - '192.168.1.1:9101'
        - '192.168.1.2:9101'
        - '192.168.1.3:9101'
        - '192.168.1.4:9101'
What if 192.168.1.1&2 was your production HaProxy and 192.168.1.3&4 was development? With the small example here, selecting the exact targets you want via their instance labels in PromQL isn’t completely unreasonable. For larger setups though, you’ll want to take advantage of labels so that you can request all of the HAProxy exporters in dev without having to list individual IP addresses.
With static configs this can be done like:
global:
  scrape_interval: 5s   # Reduced for demo sake
scrape_configs:
  - job_name: node
    static_configs:
      - targets:
        - '192.168.1.1:9100'
        - '192.168.1.2:9100'
        - '192.168.1.3:9100'
        - '192.168.1.4:9100'
  - job_name: haproxy
    static_configs:
      - targets:
        - '192.168.1.1:9101'
        - '192.168.1.2:9101'
        labels:
          env: prod
      - targets:
        - '192.168.1.3:9101'
        - '192.168.1.4:9101'
        labels:
          env: dev
Now you can use a query like avg ignoring (instance)(up{job="haproxy", env="prod"}) to see what proportion of productions HAProxy exporters were successfully scraped. This is a small example for the sake of demonstration, but in reality, you’d likely have many more targets coming from a service discovery mechanism such as Consul and the labels being applied using relabel_configs.
By applying labels to your targets, you can organize them in a way that makes sense for your deployment strategy. You might have a label for which team owns a given target; for example, both the backend and analytics teams may have their own MySQLds.
You can also apply labels to entire Prometheus servers using external_labels. Which region or datacenter a Prometheus resides in is almost always an external label, for example. As your setup grows, you will likely end up running separate Prometheus servers for dev and prod, so it makes sense to apply the env label via external_labels rather than applying to each individual target themselves.
Just as instrumentation labels are useful when analyzing what’s going on inside an application, target labels are useful when aggregating metrics across an entire deployment. Judicious use of target labels allows for answering questions, like how much CPU all development applications are currently using worldwide, or what is the total RAM usage of all applications owned by the frontend team in Europe.
Sysdig is fully compatible with Prometheus and scales Prometheus monitoring to millions of metrics with long-term retention. Try it today!