
In this post, we will show how it’s easily possible to monitor AWS Lambda with Sysdig Monitor. By leveraging existing Prometheus ingestion with Sysdig, you will be able to monitor serverless services with a single-pane-of-glass approach, giving you the confidence to run these services in production.

Having trouble scaling Prometheus monitoring?
Watch our on-demand webinar, where we share our experience using Prometheus at scale, providing different solutions and highlighting the challenges to solve in each step:
Cloud Native Monitoring: Scaling Prometheus →
The rise of serverless
Currently, we are witnessing the rise of serverless computing, such as AWS Lambda. Lambda is a Function as a Service (FaaS) resource that runs code based on events like a file arriving to a FTP server, an event in a queue or another Lambda function. This way, Lambda provides a highly scalable computing infrastructure without having to maintain and pay for spare servers when there isn’t computational load.
Once these services become part of the business, they need to be monitored the same as any other production workload to ensure their health and performance. But how can you monitor serverless services if you can’t install the Sysdig agent on them? We’ll need to rely on an intermediary like AWS Cloudwatch, the monitoring service of Amazon.
AWS Lambda and Prometheus
AWS Lambda is a serverless FaaS service that enables developers to deploy code without having to pack it into container images and trigger it through events. It also emits certain metrics that can be gathered by the CloudWatch service under the namespace AWS/Lambda.
Prometheus is a leading open source monitoring solution which provides means to easily create integrations by writing exporters. With Prometheus, you can gather metrics from your whole infrastructure which may be spread across multiple cloud providers, following a single-pane-of-glass approach.
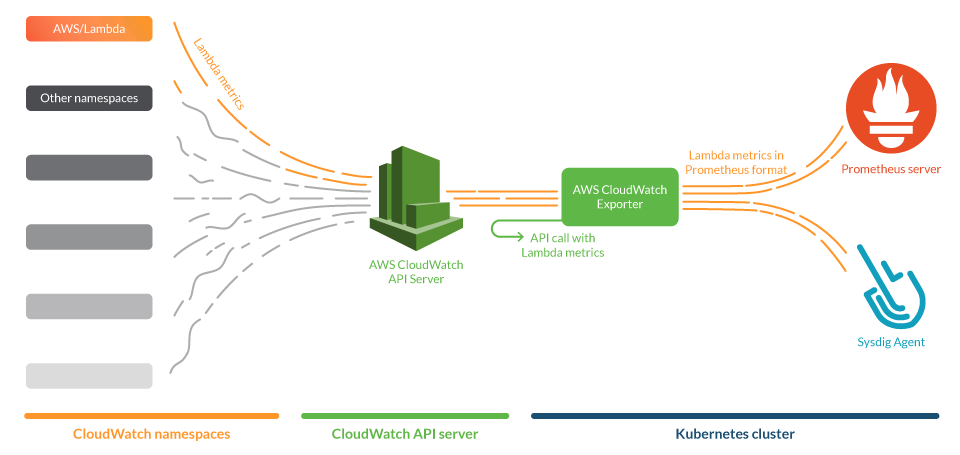
Prometheus exporters gather metrics from services and publish them in a standardized format that both a Prometheus server and the Sysdig Agent can scrape natively. We will use one of these exporters, namely yet-another-cloudwatch-exporter, to get metrics from AWS CloudWatch. We contributed to this exporter to make it more efficient and reliable.
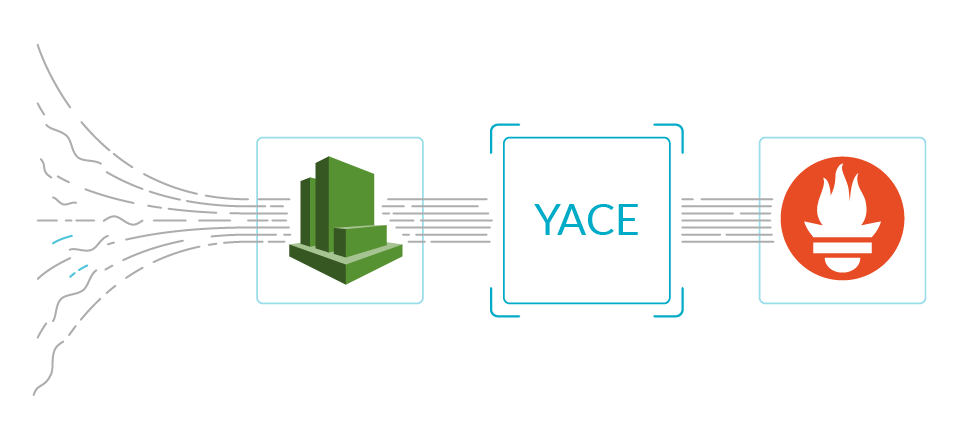
In this use case, we will deploy the CloudWatch exporter in a Kubernetes cluster and configure it to gather metrics of Lambda in AWS. This exporter will be conveniently annotated with Prometheus tags, so both a Prometheus server and the Sysdig agent can scrape it. In the figure below, we show an overall view of the system.
Installing and configuring Prometheus CloudWatch exporter
The exporter connects to the AWS CloudWatch API and asks for metrics, but to get the correct answer we need to configure some permissions. In this section, we will explain the steps to configure your AWS account with the permissions and credentials to make this connection possible.
Setting up permissions to access CloudWatch metrics
First, you will need to create an AWS IAM policy that contains the following permissions:
{
    "Version": "2012-10-17",
    "Statement": [
        {
            "Sid": "CloudWatchExporterPolicy",
            "Effect": "Allow",
            "Action": [
                "tag:GetResources",
                "cloudwatch:ListTagsForResource",
                "cloudwatch:GetMetricData",
                "cloudwatch:ListMetrics"
            ],
            "Resource": "*"
        }
    ]
}
configuration of the AWS IAM policy
You will also need to supply the credentials for an AWS IAM account to the CloudWatch exporter. This can be done in a standard manner, via $HOME/.aws/credentials file.
# CREDENTIALS FOR AWS ACCOUNT
aws_region = us-east-1
aws_access_key_id = AKIAQ33BWUG3BLXXXXX
aws_secret_access_key = bXXXXXXXXXXXXXXXXXXXXXXXXXXXXXXXXX
$HOME/.aws/credentials file.
You can either assign the IAM policy directly to the IAM account or to a IAM role to grant the permissions to the exporter.
Configuring the exporter
We opted for the yet-another-cloudwatch-exporter (YACE), which is written in Go and has images for its stable version ready to be deployed.
This exporter will fetch metrics from AWS CloudWatch and expose them in Open Metrics format. Then, they can be scraped by the prometheus ingest component of Sysdig agent, or by a Prometheus server.
The YACE exporter can gather metrics from any CloudWatch namespace. So, to monitor AWS Lambda, you just need to define the correct namespace and metrics to select the Lambda metrics that you wish to scrape.
In order to do so, first you need to create a configuration file for the exporter. In this configuration you will define which metrics the exporter will scrape, from which region and what dimensions you’ll ask CloudWatch to make the aggregations with. In this instance we will use the region us-east-1.
Here is an example config.yml configuration file:
discovery:
 jobs:
 - regions:
   - us-east-1
   type: lambda
   enableMetricData: true
   metrics:
     - name: Duration
       statistics:
       - Sum
       - Maximum
       - Minimum
       - Average
       period: 300
       length: 3600
     - name: Invocations
       statistics:
       - Sum
       period: 300
       length: 3600
     - name: Errors
       statistics:
       - Sum
       period: 300
       length: 3600
     - name: Throttles
       statistics:
       - Sum
       period: 300
       length: 3600
     - name: DeadLetterErrors
       statistics:
       - Sum
       period: 300
       length: 3600
     - name: DestinationDeliveryFailures
       statistics:
       - Sum
       period: 300
       length: 3600
     - name: ProvisionedConcurrencyInvocations
       statistics:
       - Sum
       period: 300
       length: 3600
     - name: ProvisionedConcurrencySpilloverInvocations
       statistics:
       - Sum
       period: 300
       length: 3600
     - name: IteratorAge
       statistics:
       - Average
       - Maximum
       period: 300
       length: 3600
     - name: ConcurrentExecutions
       statistics:
       - Sum
       period: 300
       length: 3600
     - name: ProvisionedConcurrentExecutions
       statistics:
       - Sum
       period: 300
       length: 3600
     - name: ProvisionedConcurrencyUtilization
       statistics:
       - Maximum
       period: 300
       length: 3600
     - name: UnreservedConcurrentExecutions
       statistics:
       - Sum
       period: 300
       length: 3600
Note that in the configuration file, the parameter enableMetricData is set to true. This is used because this API function allows the exporter to scrape several metrics in a single call. This is important to prevent throttling scenarios to the CloudWatch API that can block the AWS API service.
Please be aware of the following caveats:
- If you wish to add an additional metric, be sure to read up on AWS Lambda metrics to use the correct statistic.
- CloudWatch offers aggregations by different dimensions. The YACE Exporter automatically selects FunctionName as the default dimension to aggregate the metrics by.
- Gathering CloudWatch metrics may incur a certain cost to the AWS bill. Be sure to check the AWS Documentation on CloudWatch service Quota limits.
Once you have the IAM account credentials and the configuration file ready, you can create a Kubernetes file like the following:
apiVersion: v1
kind: Namespace
metadata:
 name: yace
---
apiVersion: apps/v1
kind: Deployment
metadata:
 name: yace-lambda
 namespace: yace
spec:
 selector:
   matchLabels:
     app: yace-lambda
 replicas: 1
 template:
   metadata:
     labels:
       app: yace-lambda
     annotations:
       prometheus.io/scrape: "true"
       prometheus.io/port: "5000"
   spec:
     containers:
     - name: yace
       image: quay.io/invisionag/yet-another-cloudwatch-exporter:v0.16.0-alpha
       ports:
       - containerPort: 5000
       volumeMounts:
         - name: yace-lambda-config
           mountPath: /tmp/config.yml
           subPath: config.yml
         - name: yace-lambda-credentials
           mountPath: /exporter/.aws/credentials
           subPath: credentials
       resources:
         limits:
           memory: "128Mi"
           cpu: "500m"
     volumes:
       - configMap:
           defaultMode: 420
           name: yace-lambda-config
         name: yace-lambda-config
       - secret:
           defaultMode: 420
           secretName: yace-lambda-credentials
         name: yace-lambda-credentials
---
apiVersion: v1
kind: ConfigMap
metadata:
 name: yace-lambda-config
 namespace: yace
data:
 config.yml: |
   discovery:
     jobs:
     - regions:
       - us-east-1
       type: lambda
       enableMetricData: true
       metrics:
         - name: Duration
           statistics:
           - Sum
           - Maximum
           - Minimum
           - Average
           period: 300
           length: 3600
         - name: Invocations
           statistics:
           - Sum
           period: 300
           length: 3600
         - name: Errors
           statistics:
           - Sum
           period: 300
           length: 3600
         - name: Throttles
           statistics:
           - Sum
           period: 300
           length: 3600
         - name: DeadLetterErrors
           statistics:
           - Sum
           period: 300
           length: 3600
         - name: DestinationDeliveryFailures
           statistics:
           - Sum
           period: 300
           length: 3600
         - name: ProvisionedConcurrencyInvocations
           statistics:
           - Sum
           period: 300
           length: 3600
         - name: ProvisionedConcurrencySpilloverInvocations
           statistics:
           - Sum
           period: 300
           length: 3600
         - name: IteratorAge
           statistics:
           - Average
           - Maximum
           period: 300
           length: 3600
         - name: ConcurrentExecutions
           statistics:
           - Sum
           period: 300
           length: 3600
         - name: ProvisionedConcurrentExecutions
           statistics:
           - Sum
           period: 300
           length: 3600
         - name: ProvisionedConcurrencyUtilization
           statistics:
           - Maximum
           period: 300
           length: 3600
         - name: UnreservedConcurrentExecutions
           statistics:
           - Sum
           period: 300
           length: 3600
---
apiVersion: v1
kind: Secret
metadata:
 name: yace-lambda-credentials
 namespace: yace
data:
 # Add in credentials the result of:
 # cat ~/.aws/credentials | base64
 credentials: |
   XXXXX
In this file, we can find:
- Namespace ‘yace’
- Deployment with the exporter. This deployment has two volumes, one with the configuration file and another with the credentials. Note that the deployment is annotated with the Prometheus tags for scraping and scraping port.
- ConfigMap of the configuration of the exporter
- Secret with the credentials of the IAM account
For a quick test, we can take a look at the CloudWatch exporter by forwarding the port 5000 of the pod yace-lambda and browse the page at:
http://<our machine>:5000/metrics
If everything goes OK, you should see a web page with metric of this kind (output truncated due to size):
# HELP aws_lambda_concurrent_executions_sum Help is not implemented yet.
# TYPE aws_lambda_concurrent_executions_sum gauge
aws_lambda_concurrent_executions_sum{dimension_FunctionName="90-percent-success-10-percent-fail",name="arn:aws:lambda:us-east-1:059797578166:function:90-percent-success-10-percent-fail",region="us-east-1"} 5
# HELP aws_lambda_duration_average Help is not implemented yet.
# TYPE aws_lambda_duration_average gauge
aws_lambda_duration_average{dimension_FunctionName="90-percent-success-10-percent-fail",name="arn:aws:lambda:us-east-1:059797578166:function:90-percent-success-10-percent-fail",region="us-east-1"} 3.5199999999999996
Monitoring AWS Lambda functions: What to look for?
Errors: While monitoring AWS Lambda, it’s important to look for errors as one of the four golden signals to monitor. CloudWatch registers the invocations that result in a function error in the metric errors. When the function is called synchronously (the process that calls the function waits for it to end and receives the result), the errors are returned to the caller of the function and can be handled or retried.
Also, Lambda functions can be asynchronously triggered from an event. In this mode, the function will return the result in a queue, a file, or by other means. But what happens when a function called asynchronous fails to send an event to a destination due to permission errors or misconfigurations? If this occurs, it will register it in the metric DestinationDeliveryFailures.
Concurrency and Throttling: Another golden signal to look for when you monitor your AWS Lambda functions is the saturation of your system. Lambda functions are designed to be called concurrently, but there is an amount of functions that you can run at the same time in your account and region, which is typically 1.000. If this limit is reached, the function will not be run and it will be registered in the metric Throttles.
What if you want to guarantee that some functions have a certain number of concurrent executions? Lambda lets you reserve concurrency and assign it to functions. This way, the function with reserved concurrency will always have that amount of possible functions running at the same time, and the rest of the concurrency will be used for the rest of the functions in your account. However, you need to be careful because if a function exceeds its reserved concurrency, its invocations will be throttled. It’s important to monitor the metric ConcurrentExecutions to adjust the reserved capacity of the functions and reduce its throttles.
In synchronous executions, the caller can relaunch the function if it was throttled, but what happens in asynchronous executions? Lambda will retry to process the event that triggers the function twice. After that, the event will be sent to a dead-letter queue that you can configure to examine the errors later. This dead-letter queue can be misconfigured or the permissions may be not set properly, and Lambda can fail posting the event in the queue. The metric DeadLetterErrors gives the number of these errors registered.
Latency and traffic: The latency of the Lambda function can be measured with the Duration metric. This gives you the milliseconds that the function took to finalize correctly (including the initialization time). This metric supports different statistics, like minimum, maximum and average. Also, you can look at the traffic (the fourth golden signal) as the number of times that a function was executed (either if it ended correctly or in error) in the Invocations metric. This metric equals the number of requests billed by AWS CloudWatch.
If a function has a long execution time, it can be optimized using provisioned concurrency. This is similar to reserved concurrency, but the function is preloaded with all of the libraries and dependencies. This reduces the time to initialize the function. To properly adjust the provisioned concurrency of each function, you can use the metrics ProvisionedConcurrencyInvocations and ProvisionedConcurrencyUtilization. If the function exceeds its provisioned concurrency limit and there is still available concurrency, the executions will use non-provisioned (standard) concurrency. These executions will be registered in the ProvisionedConcurrencySpilloverInvocations metric and give you an idea of the saturation of the provisioned concurrency of a function.
Finally, if the function is reading from a stream source, the metric IteratorAge is a good indicator of the saturation of the system. This data is the time, in seconds, that the last event spent in the stream before being processed by the Lambda function. A high iterator age means that the data in the stream is arriving at a higher rate than they are being processed by your functions.
Possible issues and alerts to detect them
Errors in code: New deployments of functions, or changes in the inputs, can cause uncontrolled errors. In this case, it’s a good practice to alert in the relative error rate better than the absolute number of errors. You can detect when the errors generated by the code of a function is over the 15% of total invocations with a promQL sentence like this:
(aws_lambda_errors_sum / aws_lambda_invocations_sum) > 0.15
Configuration problems: There are some configuration errors that can be detected with metrics and you can alert when their value is not zero. This is especially useful when the functions are asynchronously called and you cannot handle the error at runtime. These promQL queries can detect:
- Problems sending events to the destination delivery:
aws_lambda_destination_delivery_failures_sum > 0
- Problems sending events to the dead-letter queue:
aws_lambda_dead_letter_errors_sum > 0
Problems with concurrency: The main problem to alert on is when a function is throttling. This can be caused because the AWS account exceeded the total concurrency for that region, or because the function ended all of the reserved concurrency that had been assigned. In this escenario, the concurrency of the function or the account is saturated and the functions are being executed. This can be detected with the following query:
aws_lambda_throttles_sum > 0
Low performance of a function: You can alert when the execution of a function is being too slow (250ms, for example) on average with this promQL query:
aws_lambda_duration_average{dimension_FunctionName='yourFunctionName'} > 250
Also, you can alert when the incoming events in a stream are arriving at a higher rate than the processing speed of your Lambda functions. This can be mitigated by reducing the execution time of the functions with provisioned concurrency to minimize the initialization time and increase the memory of the function. This problem is revealed by a high iterator age (one second, for example). This is the promQL query to detect it:
aws_lambda_iterator_age_average > 1000
Caveats and further improvements
This was a simplistic presentation of how to monitor AWS Lambda using a Prometheus exporter to obtain some custom metrics with little effort.
Some caveats and limitations still remain:
#1: In this example, we configured the exporter to ask for metrics with a granularity of 300 seconds. This is because the exporter has a functionality that allows it to proxy the calls to CloudWatch every 300 seconds by default. However, this can be changed and adjusted for different values. Filtering your services by tags, you can set a 60 second granularity and proxy refreshing of the data for critical tasks where five minutes is not enough, and a one hour granularity for other, less critical services. This way, you can optimize the billing of your CloudWatch account.
#2: In accounts with a high number of functions, there may also be a high number of metrics provided by CloudWatch. This can translate into unexpected bills of CloudWatch usage. To avoid this, the CloudWatch exporter that we presented can be configured to filter the resources that will ask for metrics by tags. For example, maybe you can be interested in metrics for the production environment, but not from the development environment.
#3: In this example, we included the most relevant metrics available for Lambda. However, you can customize the configuration to drop some of them if you don’t need them.
Getting the CloudWatch metrics into Sysdig Monitor
Sysdig agent setup
In this section, we will show how to get these metrics into Sysdig Monitor. It’s fairly easy and requires a minimum configuration of the Sysdig Agent once installed, so it captures Prometheus metrics.
Here is some sample code that you have to insert in the file /opt/draios/etc/dragent.yaml that will perform the scraping of the container with the exporter:
10s_flush_enable: true
use_promscrape: true
prometheus:
 enabled: true
 histograms: true
 ingest_raw: true
 ingest_calculated: false
 interval: 10
 log_errors: true
 max_metrics: 3000
 max_metrics_per_process: 20000
snaplen: 512
tags: role:cluster
The main items include:
- Turning on prometheus metrics gathering.
- Specifying the process filter for prometheus scraper. Note that the Prometheus annotations for scrape, path and port are also defined in the command that launched the exporter.
Once the configuration is saved, the agent will pick it up automatically.
In a few minutes, the metrics will start trickling in and be visible in the Sysdig Monitor interface.
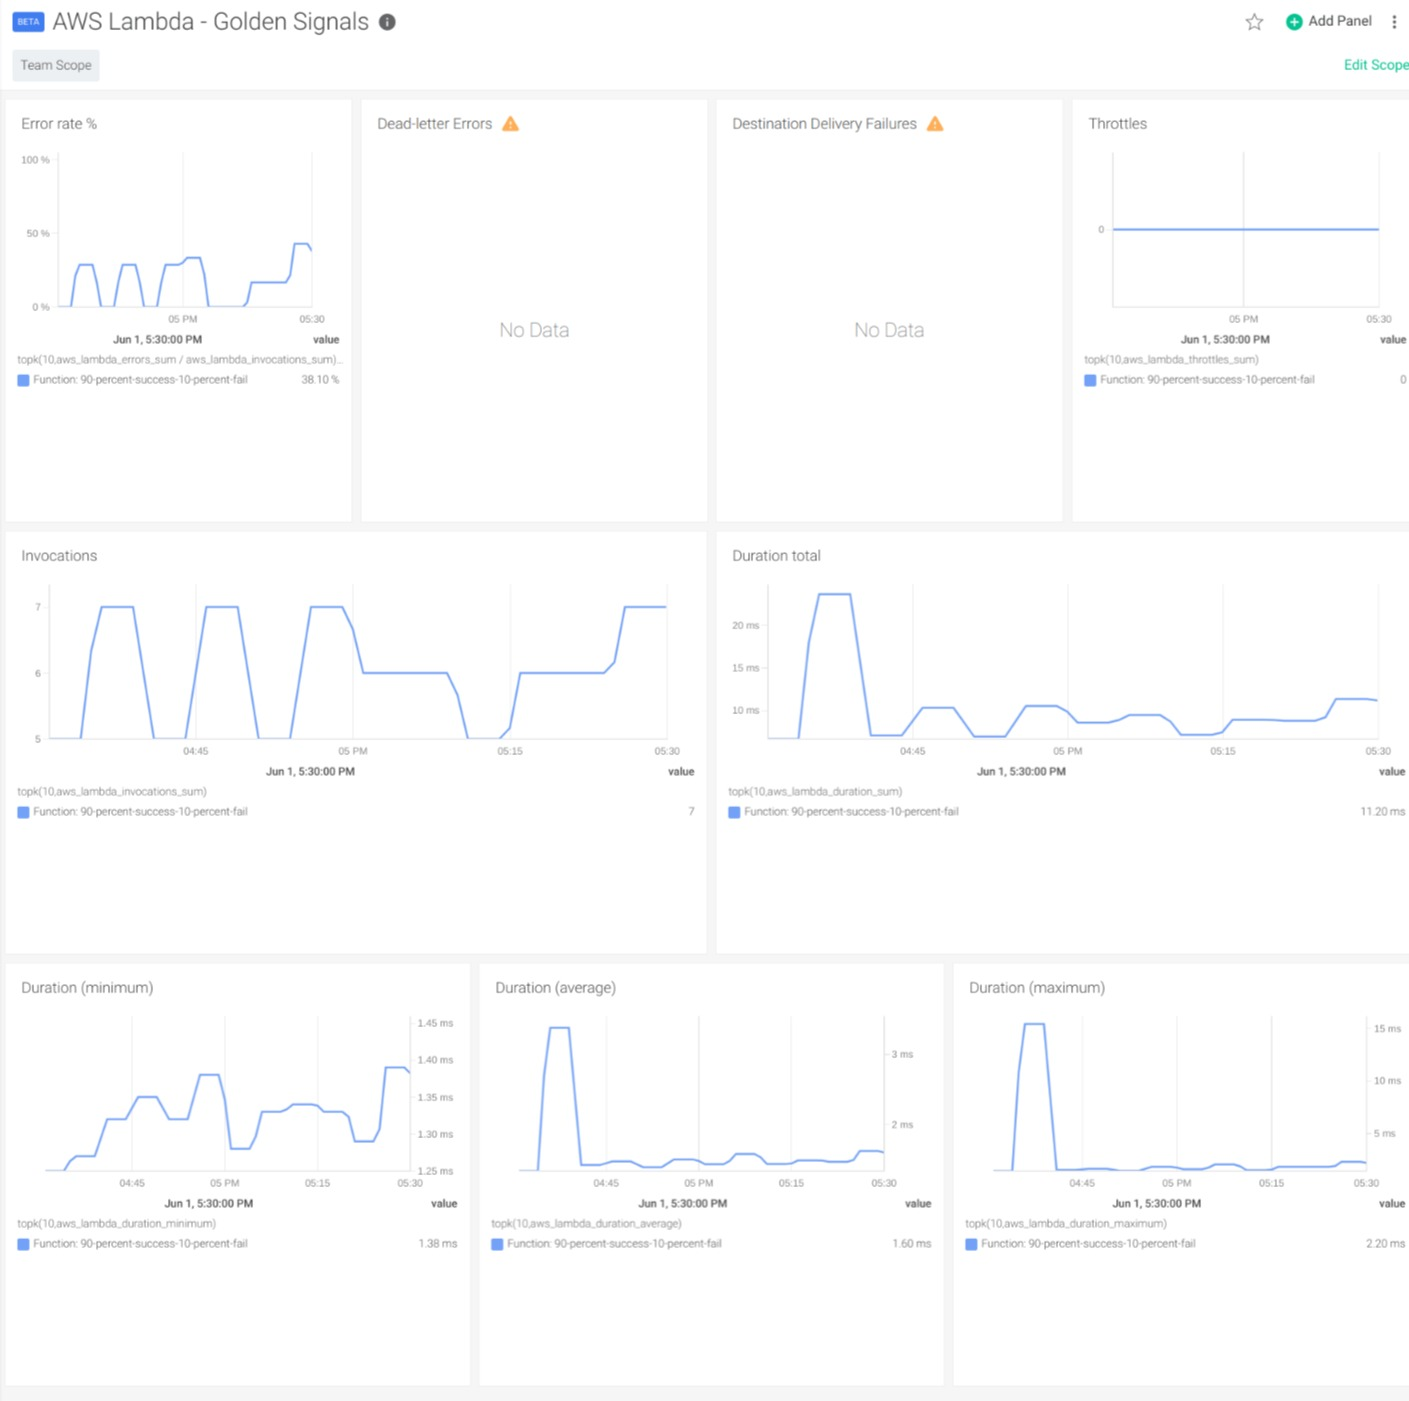
Monitoring AWS Lambda with dashboard and alerts
Once we have Lambda metrics in Sysdig Monitor, we can use dashboards to visualize them. To do so, Sysdig offers a general overview and a detailed dashboard. The Lambda Golden Signals Dashboard gives a general overview of the overall behavior of the functions in our account and lets you easily identify potential problems.
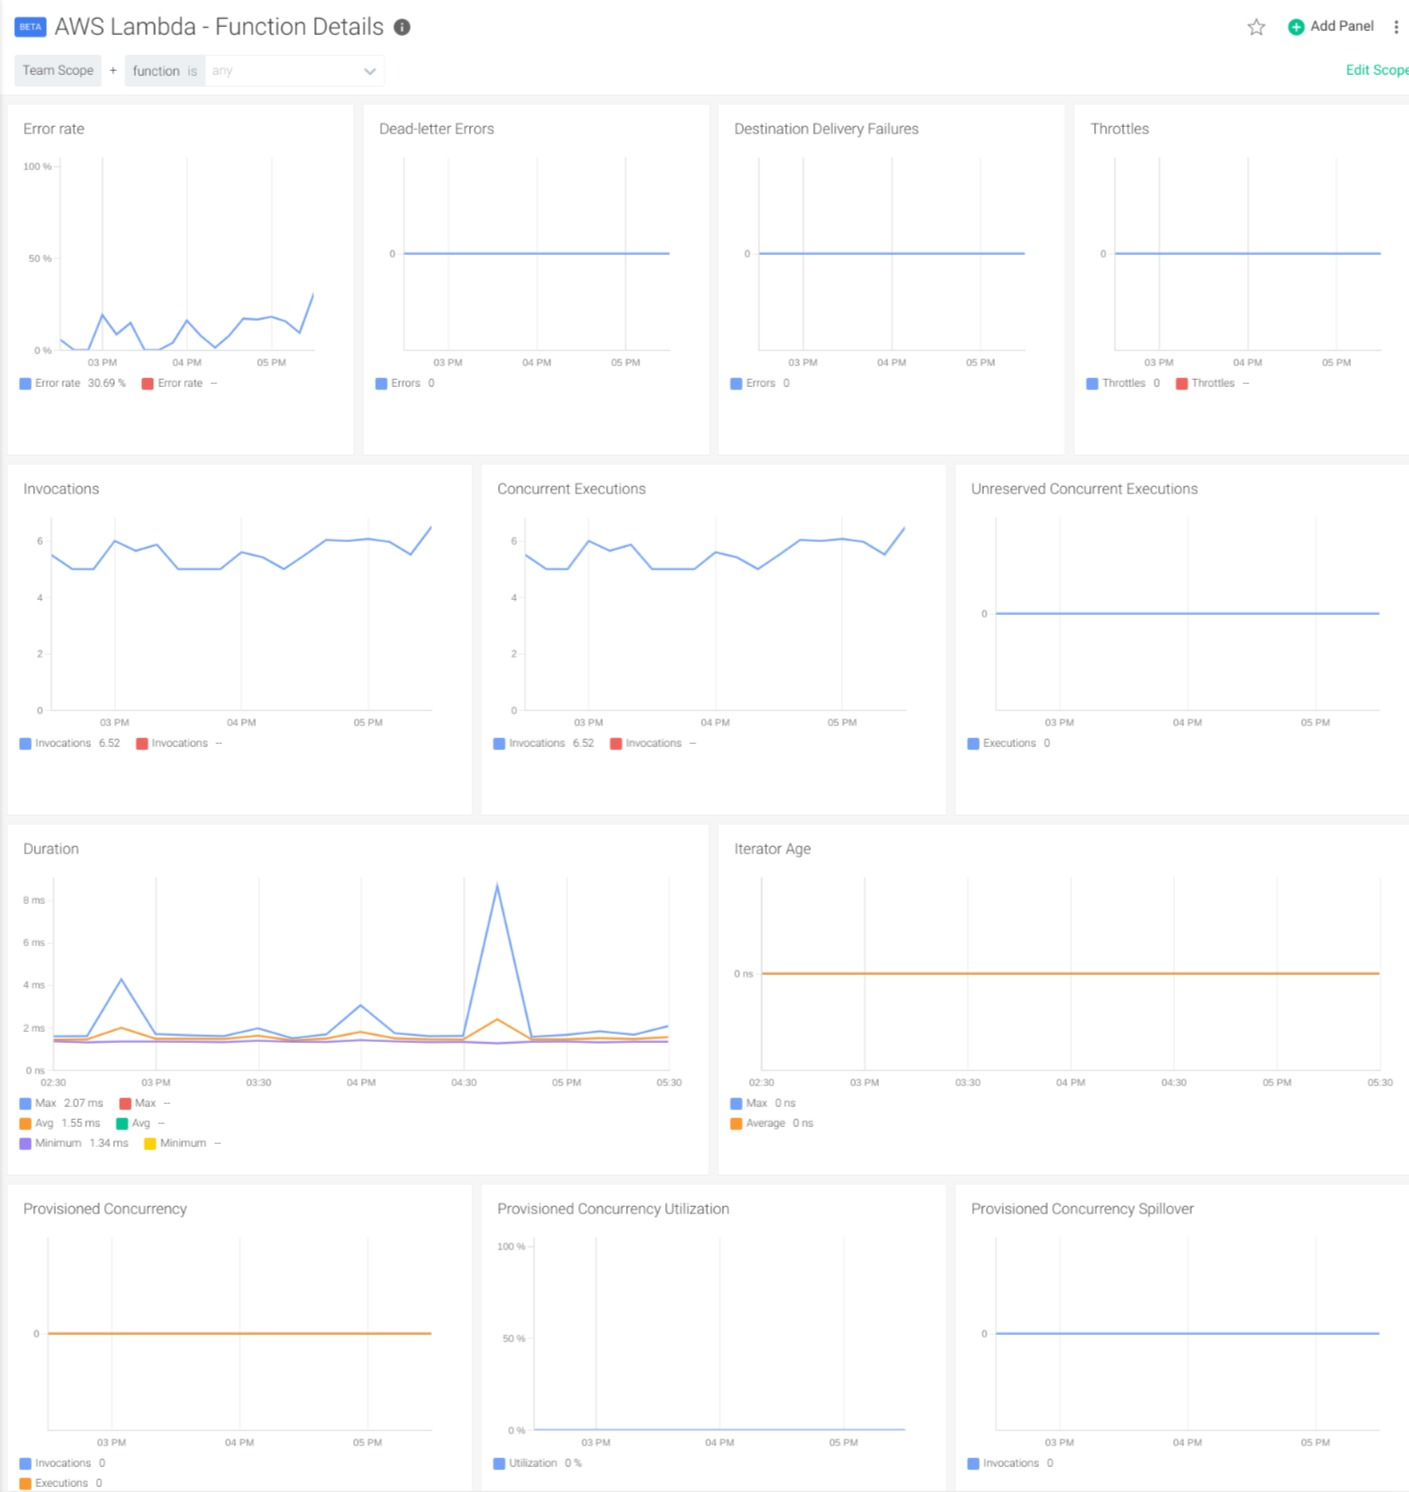
In the Function Detail Dashboard, you can use the variables to select the function that you want to inspect in detail.
Conclusion
Hopefully we’ve demonstrated that it’s really easy to monitor AWS Lambda by integrating CloudWatch metrics into Sysdig Monitor. This is possible by having a standardized interface to natively ingest Prometheus metrics and leverage existing exporters, like the CloudWatch exporter that we presented in this article.
If you would like to try this integration, we invite you to sign-up for a free trial.
You can also find instructions on how to install the exporter and ready to use configurations to monitor AWS Lambda in PromCat.io. There you will also find the dashboards that we presented in both Grafana and Sysdig format, as well as examples of alerts for your services.
You can find out more about our Prometheus integration in our documentation or by reading our blog.