
In this blog post, we are going to explain how to monitor Harbor container registry with Prometheus metrics.
Harbor is an open-source container registry, originally developed by VMware and now under the CNCF umbrella. Although many of us typically use hosted container registries such as DockerHub, Quay, ECR, GCR, or ACR, when you need a self-hosted registry, Harbor is a great choice. Harbor provides great features such as RBAC, replication, and image scanning.
But self-hosting implies that you are now responsible for maintaining this service to make sure it is up and running, keeping an eye on availability, health, and resource usage. Given this is a container images repository, disk usage will be one of the things we need to keep an eye on. Harbor depends on a number of services like PostgreSQL, Redis, and optionally Notary to sign the images and whatever image scanning service you use. To see more about these services, check out the Harbor architecture overview. If you really want to go deep, you should also monitor those external services, but let’s focus for now on Harbor itself. Ready to learn how to monitor Harbor? Let’s dig in.

Scraping Prometheus metrics from Harbor
Harbor doesn’t expose Prometheus metrics natively (although there is an issue for it: #4557). But fortunately, Max Cai wrote a Prometheus exporter that queries Harbor API and generates plenty of useful metrics.
Max makes things super easy for the users, as he provides a YAML to directly deploy this exporter in our Kubernetes cluster. In this file, we will modify a couple of things: the service where we can find the Harbor API, and where we have the credentials. Since we aren’t using ServiceMonitor CRDs, we will also annotate the deployment so Prometheus or the Sysdig agent can scrape it and collect the metrics.
We installed Harbor using the Helm chart, within the default namespace with:
$ helm install harbor harbor/harbor
So our files looks like this:
[...]
spec:
[...]
  template:
    metadata:
      annotations:
        prometheus.io/port: "9107"
        prometheus.io/scrape: "true"
[...]
          env:
[...]
            - name: HARBOR_URI
              value: harbor-harbor-core
[...]
            - name: HARBOR_PASSWORD
              valueFrom:
                secretKeyRef:
                  name: harbor-harbor-core
                  key: HARBOR_ADMIN_PASSWORD
Once ready, we just need to kubectl apply:
$ kubectl apply -f harbor-exporter.yaml
And you should be ready. If you haven’t installed Harbor before, we recommend checking out Docking Container Images Alongside Harbor In Minikube.
Harbor monitoring dashboard
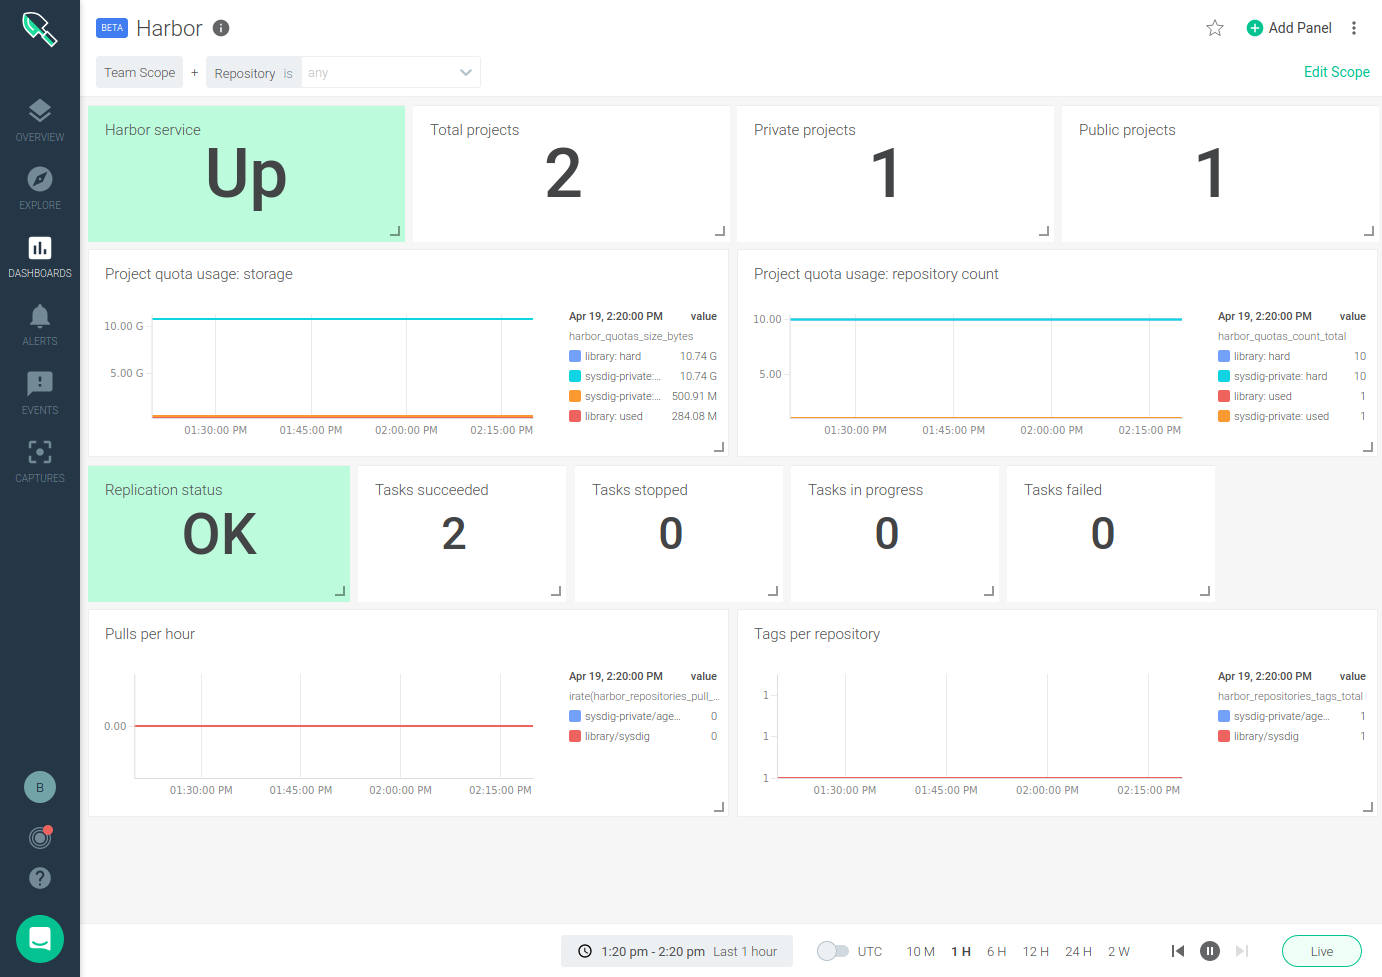
Sysdig provides an out-of-the-box Harbor dashboard for monitoring your Harbor instance.
You can also find our Harbor dashboard in our Prometheus integrations catalog: Promcat, both for Sysdig dashboards and for Grafana (you might even use Grafana against Sysdig Prometheus API if you prefer).
Understanding what each metric is and how to use it can be a little tricky, but let’s walk through each of the metrics exposed by the Harbor exporter that we include in the dashboard:
Harbor monitoring metrics
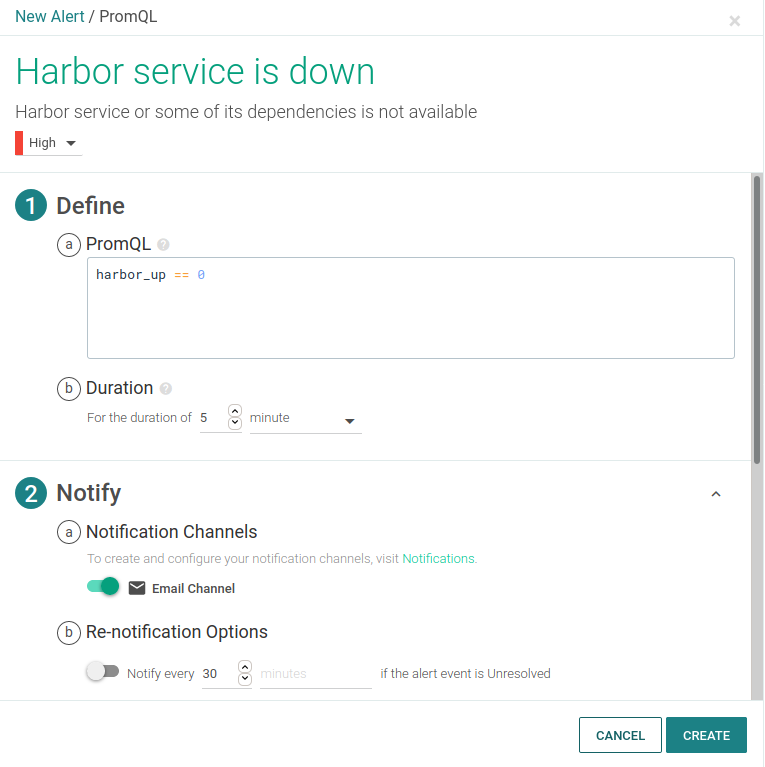
Harbor health
Making sure all of the components are up and running is the first step to take. The exporter provides a metric harbor_up which validates that all of the Harbor components are OK. In addition to finding this metric on the Harbor service panel of the dashboard, you should definitely create and alert for it:
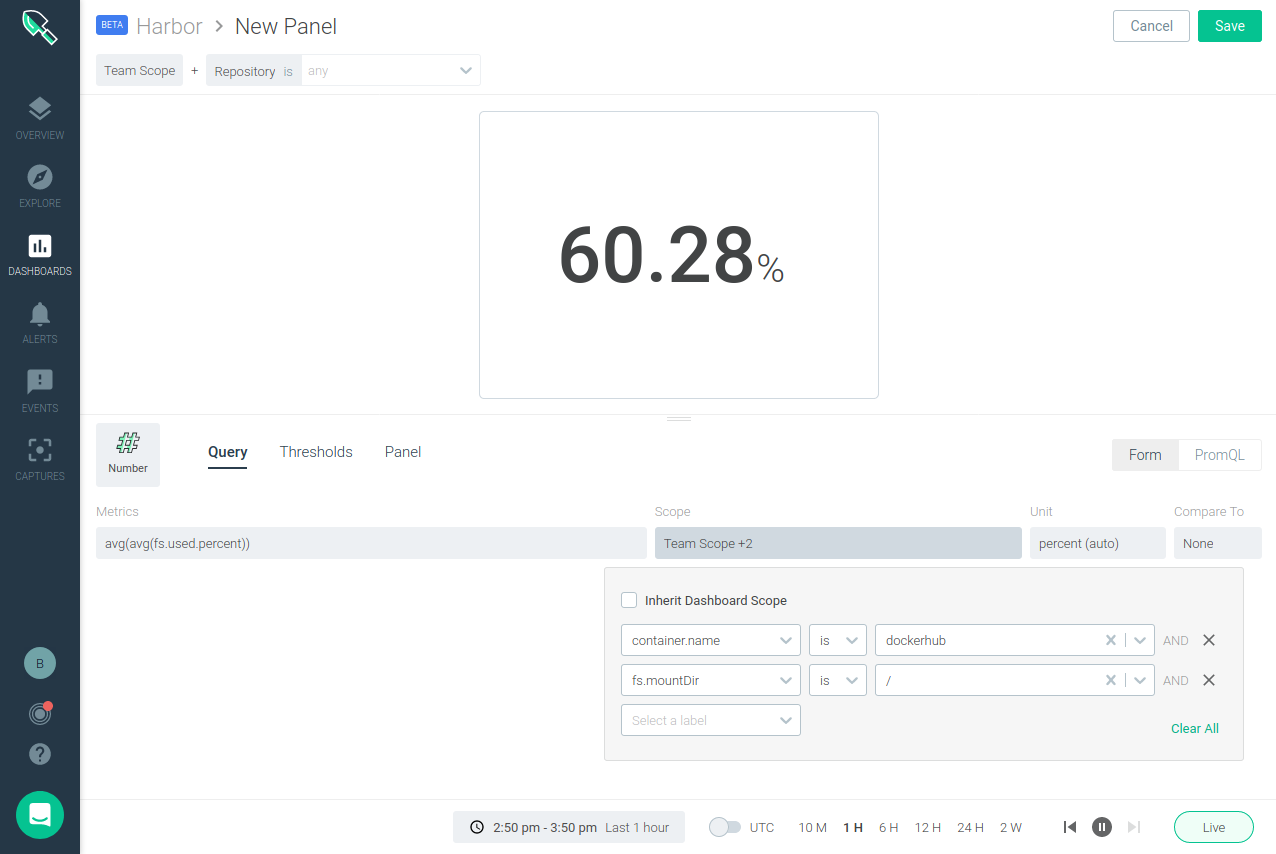
Harbor storage usage
Storage capacity usage is probably the second most important metric to look at when monitoring Harbor. You want to alert on, and probably see, in your Harbor dashboard what’s the storage usage for container images and charts in your registry. The exporter provides a metric for this: harbor_system_volumes_bytes, although being able to use it depends on the Harbor core service being able to mount the Kubernetes volume, see #441.
This is why we strongly recommend adding a panel and an alert for your storage, depending on the path where you store things, like this:
Harbor projects, quotas and repositories
On the Harbor registry you will find projects, and inside each project we can have multiple repositories. Each project can be configured to have a maximum number of artifacts, images, or charts repositories and storage quotas. In addition to monitoring the configured parameters on each repository, you can also monitor pulls, stars, and tags:
harbor_project_count_total: number of projects.harbor_repo_count_total: number of artifact repositories (not used on this dashboard).harbor_quotas_count_total: current artifact repository count and limit per project.harbor_quotas_size_bytes: storage usage and capacity quota per project.harbor_repositories_pull_total: total pulls per repository.harbor_repositories_star_total: number of stars per repository.harbor_repositories_tags_total: number tags per repository.
Harbor replication
Harbor can replicate repositories from or to other different registries. You can monitor this replication through:
harbor_replication_status: status of the last execution of a replication policy.harbor_replication_tasks: number of replication tasks by result (succeed, in progress, stopped, or failed) per replication policy.
Infrastructure monitoring for Kubernetes
With Sysdig Secure DevOps Platform, DevOps teams can secure and monitor their container and Kubernetes environments using one single platform built on open source tools, with the scale and usability enterprises demand.
Sysdig Monitor Prometheus monitoring capabilities allow you to collect Prometheus metrics and query them using PromQL. This lets DevOps teams leverage the extensive open-source Prometheus ecosystem to reduce the risk of their monitoring investment while having the confidence, Prometheus scale, and support that Sysdig provides.
Haven’t tested Sysdig yet? Sign up for a free trial now!