
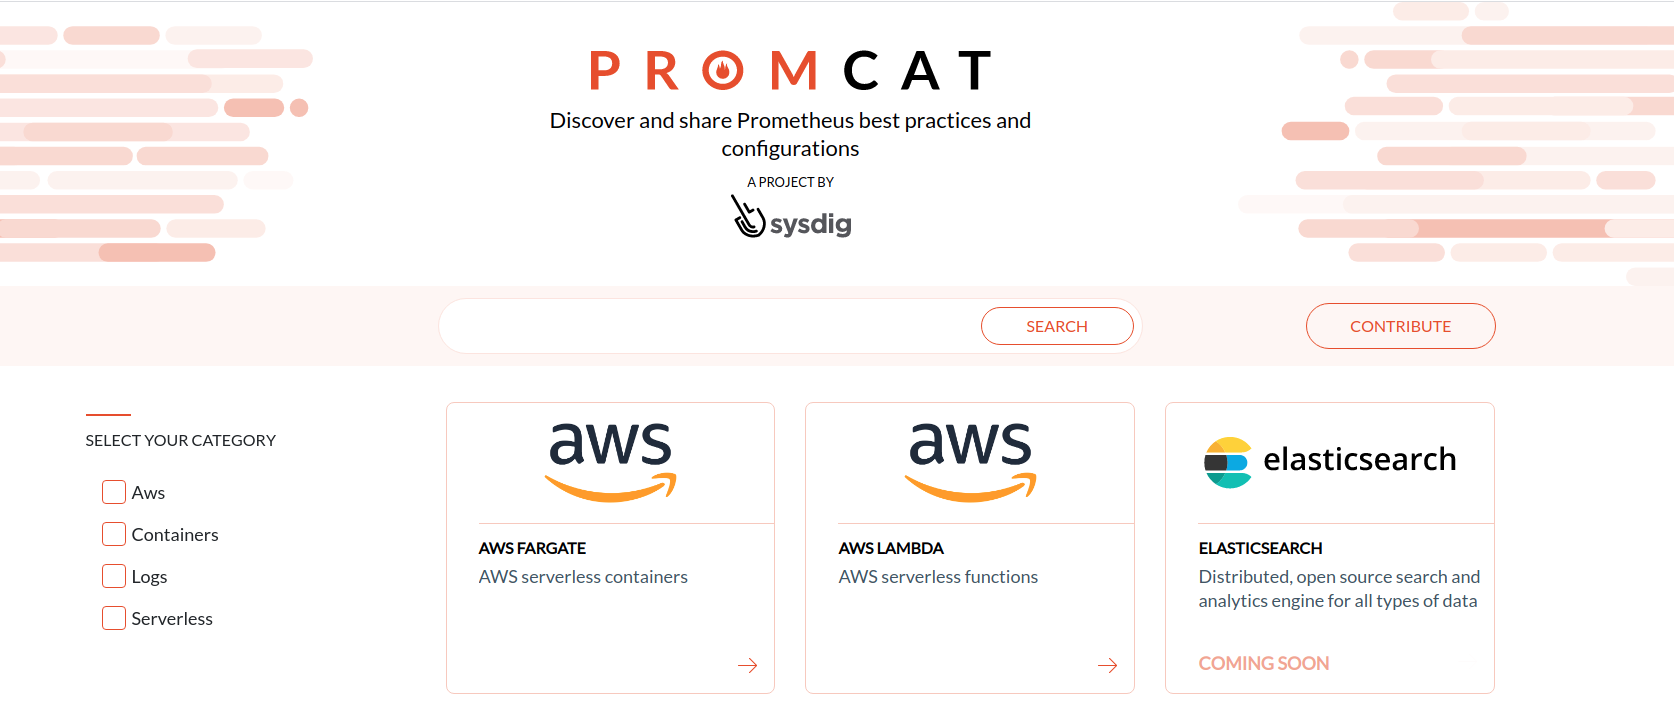
PromCat, short for Prometheus Catalog, is a resource catalog for enterprise-class Prometheus monitoring.
Prometheus has been revolutionary in the way we monitor our cloud-native environments, attracting immense attention from the open-source community and making the amount of Prometheus monitoring resources explode. Now, there are so many resources available that it’s no longer easy to filter out the good ones and discard those that are poorly documented or obsolete.
On our journey to provide a scalable Prometheus monitoring experience, we found that companies need a reliable toolbox of monitoring integrations to succeed. In addition to scale and security controls, they need a quick answer to the following question: “How can I monitor X, Y and Z in my environment?”
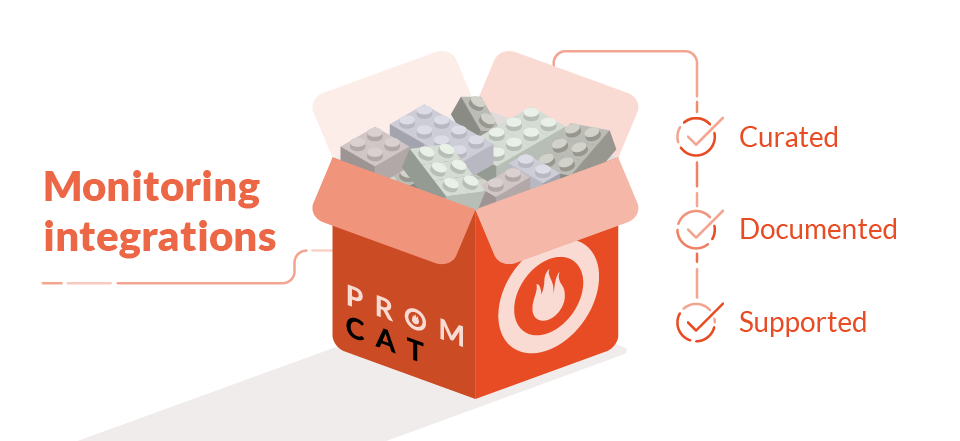
This is why we created PromCat, a resource catalog in which you can find curated, documented and supported monitoring integrations for Kubernetes platforms and cloud-native services.
This 🐈 is out of the 🛍️. PromCat is a repository of vetted and documented Prometheus integrations to monitor infrastructure, app and services in the ☁️. Click to tweetPrometheus ecosystem issues for enterprise monitoring
The strong growth of the Prometheus ecosystem has brought a tremendous amount of monitoring resources. There is more content than ever, but how can we distinguish production-ready resources for enterprise environments from untested DIY experiments? The challenge now isn’t finding content, but finding the right resource to be production-ready without investing days on setup and maintenance.
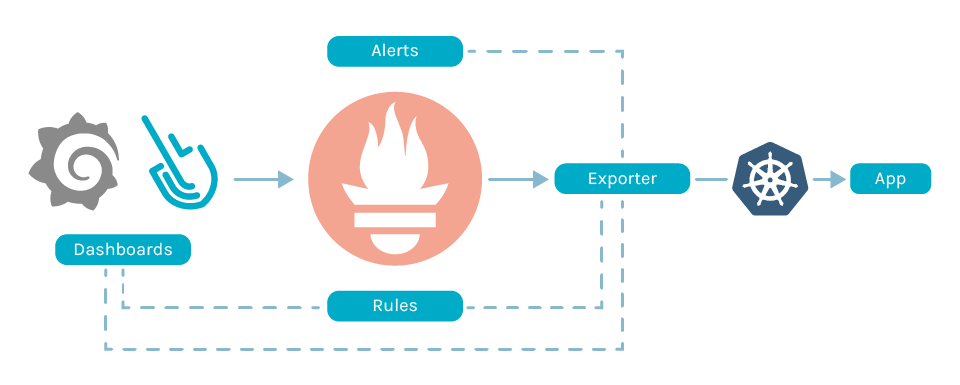
Implementing a reliable Prometheus monitoring system requires a tight integration between metrics sources (exporters, instrumented services or instrumentation libraries for your applications), Prometheus metrics collection (service discovery, jobs, filtering and relabeling or recording rules), dashboards and alerts. Making all of these different pieces work together is strenuous and requires a significant amount of effort to set up and maintain over time.
Here are some examples of resources you can find:
- Multiple exporters for different services and platforms in Github.
- Many different dashboards, often Grafana dashboards.
- Kubernetes mixin, which is great, but just scoped to Kubernetes.
With this content, the enterprise monitoring users find multiple issues.
The first one is segmentation; there are too many services, platforms, versions and places to look for. It just takes too much time to find the right tools.
Once found, how can you evaluate them and make sure the resources are feature-complete and production-grade? How can you be sure they aren’t just proof of concepts?
And before you can even test the resources, how should you download them? Sometimes they are packaged as container images in DockerHub, but occasionally they are not.

It’s hard to put everything together, even when using really good exporters or dashboards. The different pieces of the puzzle use various metric names, labels and groupings that aren’t necessarily compatible with what you use. You might find compatibility issues between different versions of exporters and specific app versions, dashboards or alerts.

To complicate things even further, there is a lack of documentation on how to use and integrate these resources.
Enterprise monitoring requires confidence in the integrations you use, with support when you configure monitoring for your environment or when things break. We have heard from our customers that they can easily spend a week trying to figure out which version of a Prometheus exporter, dashboards and alerts they should use for an integration, and how to keep up with changes.

Supported Prometheus integrations for enterprise-class monitoring
The path is pretty clear for us; we want to provide an enterprise-grade Prometheus monitoring experience. To achieve this, we are offering a backend that scales to millions of time series per second, as well as long term storage. On top of this, our product adapts to customer workflows with full Prometheus compatibility through API and PromQL queries, dashboards and alerts. You can keep using the tools that work for you, like Prometheus open-source exporters, or Grafana dashboards.
But all of this is not enough.
This is why we decided to bring together all of the awesome monitoring resources that we already recommend to our customers. And going one step further, we’re sharing them so everyone can benefit. This is why PromCat was born.
Our main goal is not to list all of the available content; the Prometheus project already lists exporters. Instead, we want to raise the bar and list the content we have curated, tested, documented and, most importantly, that we support for Sysdig customers, including:
- Prometheus and third-party exporters, packaged as container images with deployment manifests for Kubernetes.
- Both Grafana and Sysdig dashboards. Most of our customers love Sysdig integrated dashboards, with Team scope and RBAC, which are available alongside our troubleshooting and security functionality. But some advanced users prefer Grafana with Sysdig metrics so they can customize every single detail of their dashboarding experience. Both are supported in this catalog.
- Both AlertManager and Sysdig PromQL alerts definition.
- Recording rules, in order to pre-calculate metrics when you have tons of them.
Because many of these resources are already available as open-source software, our compromise is to also give back to the community that has originally created them. We’ll contribute any bug fixes and improvements we do as part of our maintenance and support.
What’s next for PromCat
We are launching PromCat today with monitoring resources for the Kubernetes control plane, the Istio service mesh and a growing list of AWS services.
Sysdig integration engineers are already working to add new resources for typical services in cloud-native environments, and also to improve the packaging and setup process of these integrations in your environment. We have a quite long list of services and platforms we want to extend our support to.
We want to decide what comes next together with Sysdig customers and partners.
Visit PromCat.io to browse and download resources for enterprise-class Prometheus monitoring. You can use those resources today, along with Sysdig’s new cloud scale Prometheus monitoring capabilities. Haven’t tested Sysdig yet? Sign up for a free trial now!