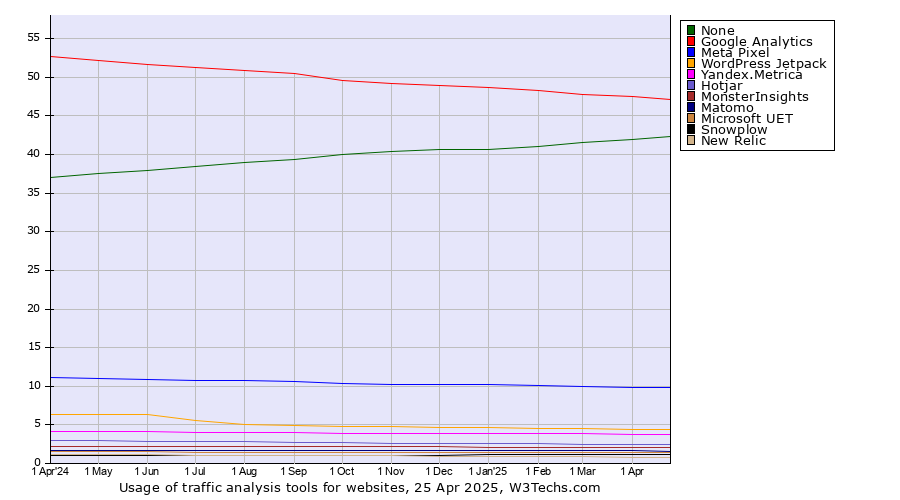
Technologies > Traffic Analysis Tools > Usage Trend > Monthly Historical trends in the usage statistics of traffic analysis tools for websitesThis report shows the historical trends in the usage of the top traffic analysis tools since April 2023. | 2023
1 Apr | 2023
1 May | 2023
1 Jun | 2023
1 Jul | 2023
1 Aug | 2023
1 Sep | 2023
1 Oct | 2023
1 Nov | 2023
1 Dec | 2024
1 Jan | 2024
1 Feb | 2024
1 Mar | 2024
1 Apr | 2024
27 Apr | | None | 34.1% | 34.2% | 34.4% | 34.4% | 34.8% | 35.0% | 35.2% | 35.5% | 35.8% | 36.0% | 36.3% | 36.6% | 37.0% | 37.5% |
|---|
| Google Analytics | 56.8% | 56.7% | 56.4% | 56.3% | 55.7% | 55.2% | 55.0% | 54.6% | 54.2% | 53.9% | 53.6% | 53.1% | 52.7% | 52.2% |
|---|
| Facebook Pixel | 11.1% | 11.2% | 11.1% | 11.2% | 11.2% | 11.3% | 11.2% | 11.2% | 11.2% | 11.2% | 11.2% | 11.1% | 11.1% | 11.0% |
|---|
| WordPress Jetpack | 5.0% | 5.0% | 5.0% | 5.2% | 5.8% | 6.0% | 6.1% | 6.1% | 6.1% | 6.2% | 6.2% | 6.3% | 6.3% | 6.3% |
|---|
| Yandex.Metrica | 4.9% | 4.9% | 4.8% | 4.7% | 4.6% | 4.6% | 4.5% | 4.5% | 4.5% | 4.4% | 4.3% | 4.3% | 4.2% | 4.1% |
|---|
| Hotjar | 3.3% | 3.3% | 3.3% | 3.2% | 3.2% | 3.2% | 3.2% | 3.1% | 3.1% | 3.1% | 3.1% | 3.0% | 3.0% | 2.9% |
|---|
| MonsterInsights | 2.9% | 2.9% | 2.9% | 2.9% | 2.4% | 2.3% | 2.2% | 2.2% | 2.2% | 2.2% | 2.2% | 2.2% | 2.2% | 2.2% |
|---|
| Matomo | 1.5% | 1.5% | 1.5% | 1.5% | 1.6% | 1.6% | 1.6% | 1.6% | 1.6% | 1.7% | 1.7% | 1.7% | 1.7% | 1.7% |
|---|
| Microsoft UET | 1.6% | 1.6% | 1.6% | 1.6% | 1.6% | 1.6% | 1.7% | 1.7% | 1.7% | 1.6% | 1.6% | 1.6% | 1.6% | 1.5% |
|---|
| New Relic | 1.3% | 1.3% | 1.3% | 1.3% | 1.3% | 1.3% | 1.3% | 1.2% | 1.2% | 1.2% | 1.2% | 1.2% | 1.2% | 1.1% |
|---|
| Snowplow | 0.9% | 0.9% | 0.9% | 0.9% | 0.9% | 0.9% | 0.9% | 0.9% | 0.9% | 0.9% | 0.9% | 1.0% | 1.0% | 1.0% |
|---|
| LiveInternet | 1.1% | 1.1% | 1.1% | 1.1% | 1.1% | 1.0% | 1.0% | 1.0% | 1.0% | 0.9% | 0.9% | 0.9% | 0.8% | 0.8% |
|---|
| LinkedIn Insight Tag | 0.9% | 0.9% | 0.9% | 0.9% | 0.9% | 0.9% | 0.9% | 0.9% | 0.8% | 0.8% | 0.8% | 0.8% | 0.8% | 0.8% |
|---|
The diagram shows only traffic analysis tools with more than 1% usage.
 | Find more details in our extensive traffic analysis tools market reports. Learn more
|
Share this page |  LinkedIn
 Twitter
 Mastodon
 Bluesky