React has gained significant popularity as a library for building UIs on the web. One of the main attractors to the library is its impressive browser performance, thanks to its implementation of a virtual DOM.
When working on small projects, you shouldn’t run into many issues. However, larger projects will typically have complex UI components, process more data, and generally have more moving parts. All of these factors can impact the performance of your app.
This article will help you understand what tools you have at your disposal to measure React performance. This can help you optimize Core Web Vitals metrics like Interaction to Next Paint.
Three different approaches to measuring React performance
We’re going to cover the use of three different approaches:
- Using the Chrome DevTools Performance tab
- Using the React Developer Tools Chrome extension
- Using React's Profiler API
Using Chrome DevTools
Chrome DevTools is a set of utilities shipped with Google Chrome to help developers debug issues with their websites at runtime.
DevTools gives us a visualisation of the performance of your app. To see this, ensure that you are running React in development mode, open DevTools in your browser and then go to the “Performance” tab.
You can record the performance of your app from a point after the page has loaded or from the page load. There are two buttons in the top-left corner of the DevTools dialog:
![]()
To begin recording after the page has loaded, click the grey circle icon, to record from the page load, click the reload icon.
After you have clicked "Stop" or the page has finished loading, you will see a series of bars across a timeline. The width of each bar indicates how long that particular bit of code took to run.
The section labelled "Timings" contains the computation time used by React for your components. We are able to see this level of granularity thanks to the data being published by React to the User Timing API, while the app is rendering.
The section labelled "Main" isn't React-specific and includes all JavaScript function calls. This is useful to identify code within a particular React component that takes a long time to run.

Within the tab labelled “Call Tree” in the bottom pane, we can see the “Self Time” taken for each component’s render (e.g. Text [update]). "Self Time" is the cumulative amount of time spent rendering the component, excluding its children. The "Total Time" includes child rendering times.
You can use the DevTools Performance tab to see which components are rendering and when, and how long rendering different components takes.
Using React Developer Tools
React Developer Tools is a Chrome extension that lets you inspect the props and state of your components, as well as inspect their performance.
In the React Developer Tools tab, there will be a tab called "Profiler". Click the record button to start recording performance data and, after using your app, click the "Stop" button.

The Profiler will display a flame chart of the components in your app and how long they had taken to render, represented by the length of the bar. A commit is when the determined changes to the DOM are applied by React.
Bars in grey represent components that did not render during the commit and bars in the blue-yellow color range represent components that rendered during the commit. Yellow indicates a longer own render time of the components, and blue-greens represent shorter times.

The current commit is indicated by the black bar in the set of 12.
The right-hand pane shows timing information about the commit and when a component is selected, it will show the component's props and state. Clicking the blue chart icon at the top-right of the dialog will show a bar chart of the component's render times.

The Profiler tab gives us a convenient, visual way to inspect render times and navigate through commits while viewing the props and state of components, making it faster to investigate performance issues and impact.
See why a component re-rendered
React Developer Tools can also show what prop or state changes caused a re-render. First, enable the Record why each component rendered while profiling in the settings.

Future profiles will then show the reason a component rendered, for example a prop change, or because the component just mounted and rendered for the first time.

Using the "Profiler" React component
The unstable_Profiler component is a relatively new addition to the library. Shipped in version 16.4, <Profiler /> was built to help measure timing in components' lifecycle.
The Profiler component takes two props:
id: an identifier for what you're profilingonRender: a callback that's called after a mount or update
Your code would look something like this:
import React, { unstable_Profiler as Profiler } from "react";

class MyComponent extends React.Component {
  clockPerformance(
    profilerId,
    mode,
    actualTime,
    baseTime,
    startTime,
    commitTime,
  ) {
    console.log({
      profilerId,
      mode,
      actualTime,
      baseTime,
      startTime,
      commitTime,
    });
  }

  render() {
    return (
      <Profiler id="test" onRender={this.clockPerformance}>
        <MyComponent />
      </Profiler>
    );
  }
}
The onRender function receives the following arguments:
profilerId: The string passed to theidprop of<Profiler />.mode: The name of the point in the lifecycle: either "mount" or "update".actualTime: The time that ellapsed between when the component started rendering and when it finished rendering.baseTime: The sum of the most recent update times of the component and all its children. IfshouldComponentUpdatewas false then the most recent duration of an actual update is used.startTime: The timestamp in ms of when the render process began.commitTime: The timestamp in ms of when DOM changes were applied.
Here's some example output:

You can notice a few things:
- The initial render was really quick, because the required data wasn't available yet and it just rendered a spinner.
- Once the data was loaded it rendered the whole component content.
- On additional updates only a small part of the component is re-rendered. But while it actually took only 4ms to update the component
baseTimeis still at 234ms.
To brign down the baseTime you need to reduce the amount of work done when rendering your components. To reduce the actual time avoiding unnecessary updates using shouldComponentUpdate or PureComponent might be enough.
A more useful use case for this could include some tracking of certain events or actions within your component and then flagging render times based on certain conditions.
If you want to measure render times in production you can include the Profiler component in your production build, but it requires changes to your bundler setup.
Conclusion
For many use cases the React Developer Tools are the most powerful option for inspecting the performance of React apps. It provides us with a graphical way to observe rendering times while bringing in the context of components by displaying props and state alongside the performance metrics. This is great for exploring or identifying performance bottlenecks. However, you can't use the Profiler tab when working with a production bundle.
Chrome DevTools' Performance tab helps us to see how our app's code affects the rendering of React components. We can identify CPU-heavy code, such as filtering long lists or generating a report. It also provides context on when the rendering took place, especially in relation to when a network request finished.
The Profiler component lets you measure just what you're interested in. Being able to access the performance data in your application code gives you full control over what you want to do with it.
All three are very useful tools to optimize React app performance.
Are unnecessary re-renders slowing down you app? Learn how to avoid unintentional React component re-renders..
Monitor the speed of your website
React applications can often cause performance problems, especially for the initial page load. DebugBear can keep track of performance over time and helps you identify potential optimizations.
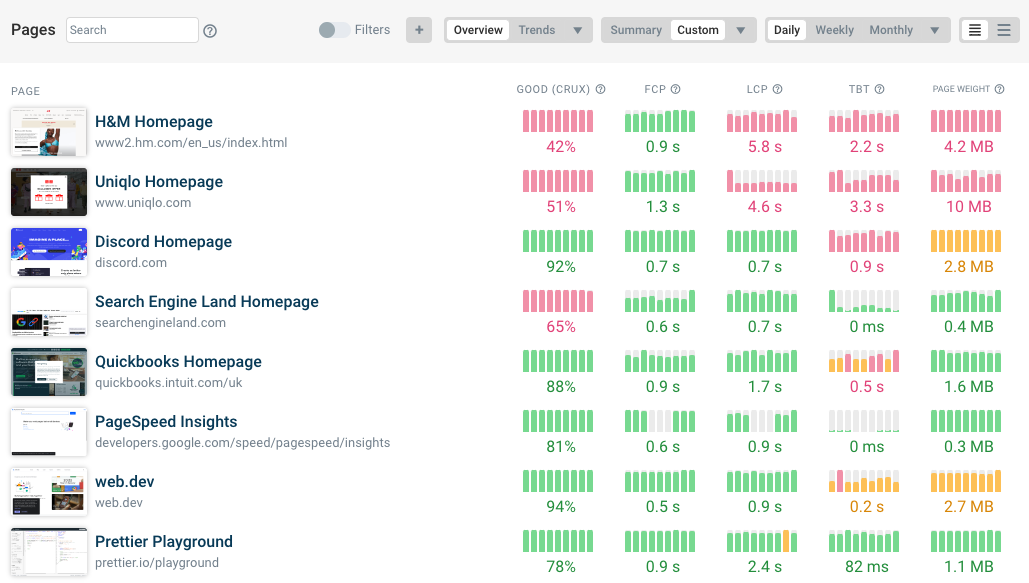
Each test results includes an in-depth technical report as well performance recommendations specific to your website.