Measure And Optimize First Contentful Paint (FCP)
First Contentful Paint (FCP) measures how long it takes for content to start appearing on a website. FCP is measured in milliseconds and used to assess the loading speed of a website.
This article explains how the First Contentful Paint is defined, and how to measure and optimize it. We'll also look at how it relates to other page load speed metrics.
What is the First Contentful Paint?
The First Contentful Paint metric measures how soon after opening a website the user can see some content on the page. Usually this means that text or an image have is visible.
This rendering milestone tells the user that something is happening and that the page has started to load.
FCP stands in contrast to two other metrics measuring rendering progress:
- First Paint marks the time when the page first starts rendering – unlike FCP this could be an empty box with no content
- Largest Contentful Paint marks the time when the largest content element on a page is rendered
If all page content appears at the same time then these three metrics can have the same value. However, if they are different then the First Paint occurs before the First Contentful Paint, and the First Contentful Paint occurs before the Largest Contentful Paint.
This image shows the rendering progress an example website:
- At first only empty boxes are shown (First Paint)
- Then a logo appears at the top of the page (First Contentful Paint)
- Additional content appears, including a paragraph that's the largest page element (Largest Contentful Paint)

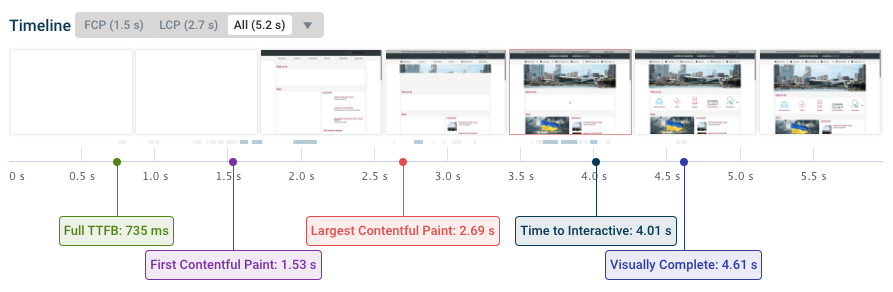
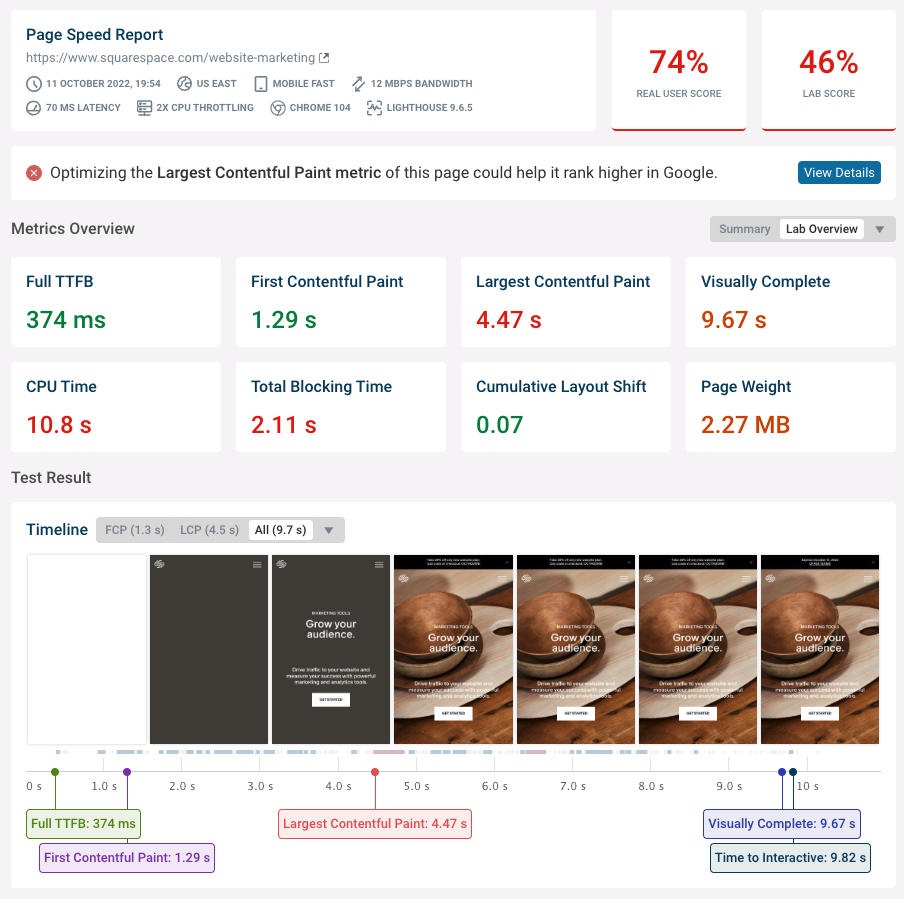
Here's another example showing the different milestones in the page load process:
- Time to First Byte: the initial server response
- FCP and LCP
- Time to Interactive: when the CPU and network are idle
- Visually Complete: when the UI stops updating
Run A Free Page Speed Test
Test Your Website:
- No Login Required
- Automated Recommendations
- Google SEO Assessment
Do background images count as content for First Contentful Paint?
Yes, if a background image is rendered the paint will be considered contentful.
What is a good First Contentful Paint?
Websites should have an FCP of 1.8 seconds or less.
While First Contentful Paint is not one of the Core Web Vitals that impact Google rankings, it is still one of Google's broader set of Web Vitals metrics. The Largest Contentful Paint is one of the Core Web Vitals metrics, and it can never be lower than the First Contentful Paint.
| FCP range | Rating |
|---|---|
| < 1.8 seconds | Good |
| < 3.0 seconds | Needs Improvement |
| > 3.0 seconds | Poor |
How does First Contentful Paint affect the Lighthouse performance score?
As of version 10.0.1 (February 2023) the First Contentful Paint metric accounts for 10% of the overall Performance score.
The performance subscore for FCP is visible in DebugBear for example:
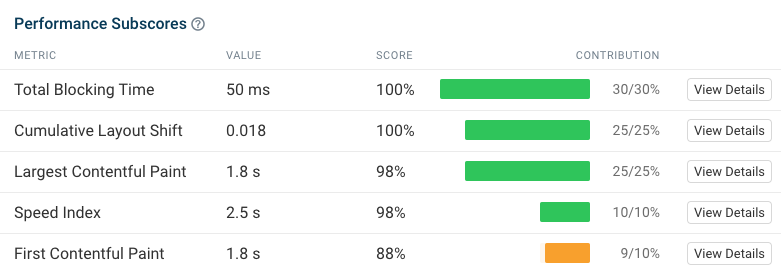
This table shows the maximum value you'd need to reach for a certain FCP score.
| FCP subscore | Max FCP (Mobile) | Max FCP (Desktop) |
|---|---|---|
| 100 | 1.0s | 0.5s |
| 90 | 1.8s | 0.9s |
| 50 | 3.0s | 1.6s |
| 10 | 5.0s | 2.7s |
The initial document request requires at least 4 network round trips on an HTTPS connection (DNS, TCP, SSL, and HTTP). Lighthouse simulates a roundtrip time of 150 milliseconds on mobile, so a perfect mobile Lighthouse FCP would be 600 milliseconds.
This does not include your server response time or time the data spends traveling from your ISP to the website's data center.
On desktop Lighthouse uses a roundtrip time of 40s, so the minimum FCP would be 160ms.
How to optimize First Contentful Paint
The most common cause of a slow FCP are render-blocking scripts and stylesheets. Start by reducing the number of these resources to improve your First Contentful Paint metric.
You should also reduce server response time.
Render-blocking stylesheets
For example, take a look at this DevTools recording of the DebugBear homepage. What resources need to load before content starts to appear on the page?
- The HTML document
- Two CSS files

The two CSS files are render-blocking and placed in the document head element. You could avoid this by inlining the CSS directly into the document HTML as a style tag. However, this would mean re-downloading the CSS as part of every document request, rather than using the cache after the first visit.
In this case we only have three render-blocking resources. The longest request chain is 2 requests long, because both CSS requests are triggered at the same time and can be made in parallel. So overall the FCP in this example isn't too slow.
Ideally all critical CSS that's required to render above-the-fold content can be embedded directly in the document response.
Render-blocking scripts
This chart shows another website, this time for a site with multiple render-blocking scripts. All of these need to be loaded before any page content starts to show.

This website does not require the loaded JavaScript code for the initial render, so the script tags could be moved further down in the HTML, for example to the end of the body tag. Moving the script tags there will ensure they are no longer render-blocking. Alternatively, you can add the async attribute to the script element.
If you're loading scripts on your website, keep in mind that they not just need to be downloaded, but also parsed, compiled, and executed.
Fonts and First Contentful Paint
Web fonts are fonts that need to be downloaded before the text using that font is displayed. Accordingly, using web fonts will make FCP worse in most cases.
The website in the previous section loads a CSS file that then in turn loads a Google Font.
However, the browser doesn't block rendering until the font is loaded, thanks to the font-display: swap CSS property. This property means that if the font isn't available yet, then the browser uses a fall-back font instead. On Google Fonts you can achieve this by appending &display=swap to the CSS URL.
Reduce server response time
Stylesheets and JavaScript files are static resources, and the server can usually provide a response quickly. However HTML or Ajax responses are generated dynamically, so the server can introduce a significant processing delay.
You can check the response time of your server in the DevTools Network tab. The entry is the request for the initial HTML document. In this case, the server took 2.2s to respond and in total the request took 2.7s from start to finish.

Try to keep your server's response time below 600ms to reduce First Contentful Paint.
Slow server responses are more likely if the backend is responsible for rendering the page content. For example, if you have a Wordpress site with lots of plugins this can cause significant rendering delays. On the flip side, rendering content on the server also reduces processing time in the browser and avoids unnecessary network round trips.
Read more about improving server response time.
First Contentful Paint definition
The exact meaning of the FCP metric is defined in the Paint Timing API.
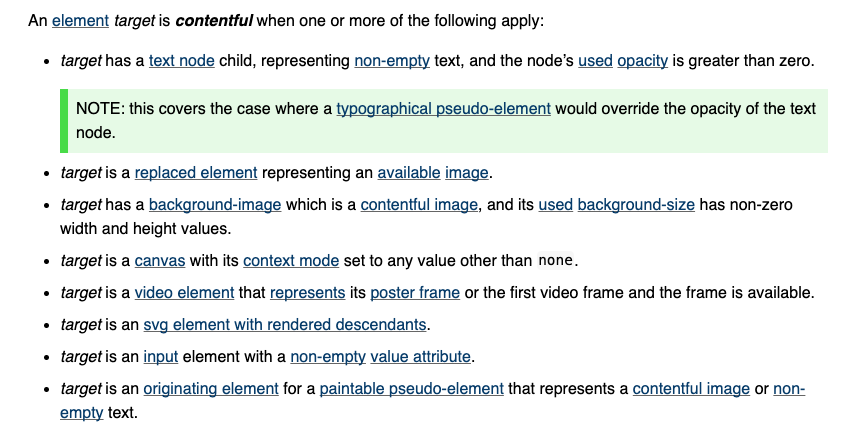
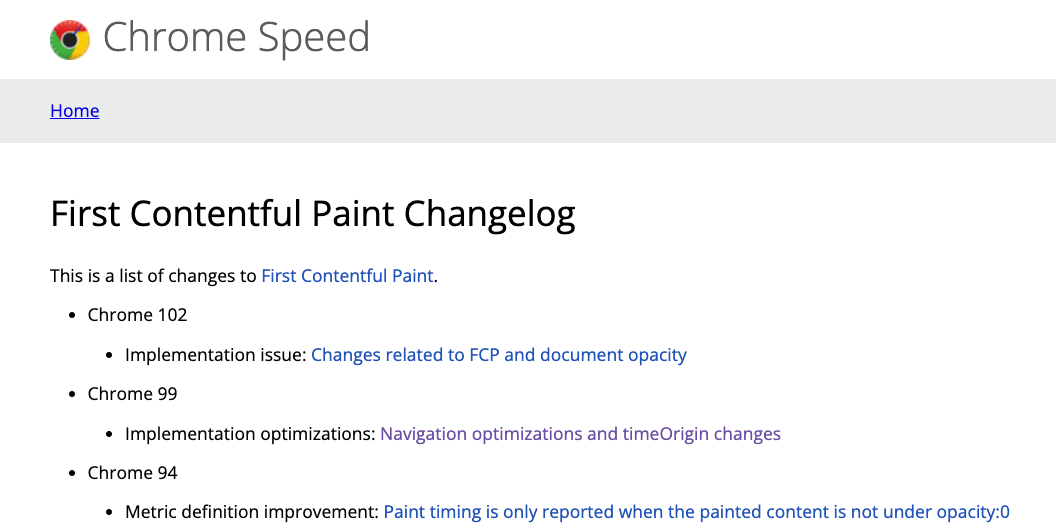
Different versions of Chrome also measure FCP slightly differently. Google also maintains a changelog of these changes. When users upgrade to a new version of Chrome you may see changes in your metric without an underlying change to your website.
How to measure First Contentful Paint
There are many different tools that can measure FCP. The data is collected in different environments, so the reported metrics can differ between tools.
To measure FCP you can use:
- Google's PageSpeed Insights tool
- The DebugBear Speed Test
- Lighthouse in Chrome DevTools
- The
Performanceweb API
First Contentful Paint in PageSpeed Insights
Google PageSpeed Insights can provide both aggregate data from real Chrome users and run one-off lab-based tests. The real user data is taken from the Chrome User Experience Report (CrUX).
The number shown in the FCP section of the real-user data shows that 25% of users experienced an FCP worse than this value. In this example, this means 25% of user experiences had an FCP of 2.2 seconds or worse, while 75% of user experiences were faster than 2.2 seconds.

If you click on Expand view you can see a more detailed breakdown of Good, Ok, and Poor experiences.

When testing a page, PageSpeed Insights also runs a one-off test from a Google server. This allows them to provide additional debug information that's not available for the real-user metrics.
The lab-based data is also useful if the page you're testing doesn't receive enough traffic to provide real user metrics.

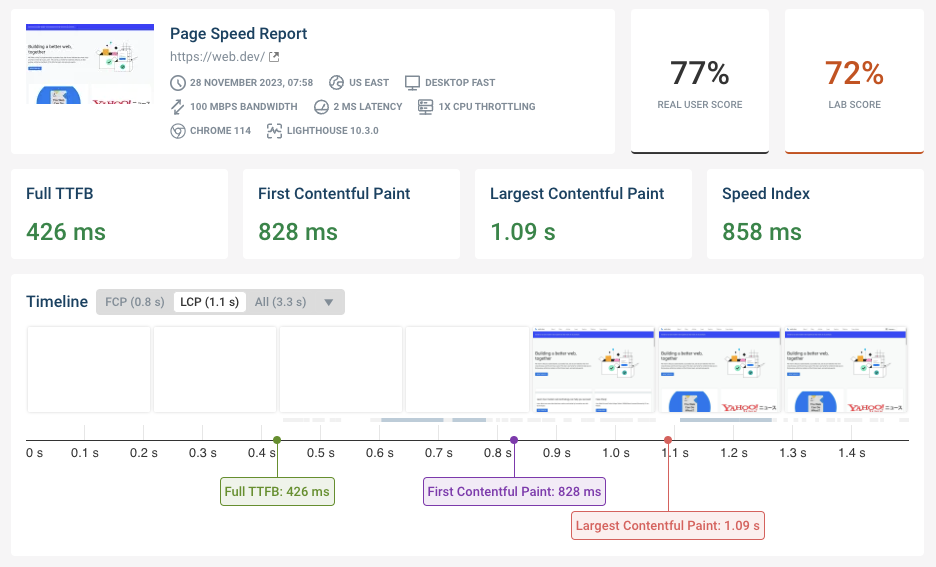
Testing website speed and FCP with DebugBear
The free DebugBear site speed test analyzes your website and helps you understand First Contentful Paint and other performance metrics.
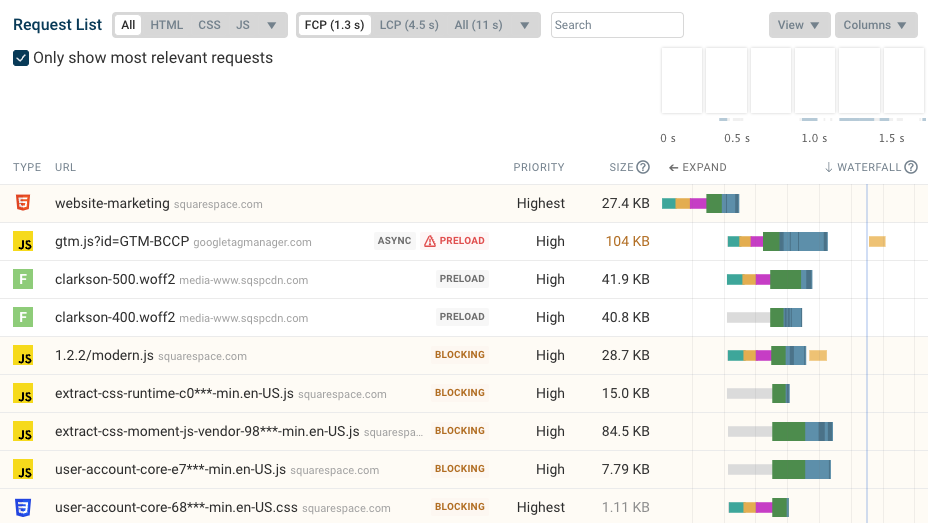
You can click on the FCP metric to view details about why the page renders at that point. The request waterfall shows what resources need to be loaded before the page can render.
The FCP milestone is indicted by the blue line. The page can only render after the render-blocking resources have been loaded.
First Contentful Paint in Lighthouse
You can find the FCP in the top left of the top of the Lighthouse Performance section.

To find opportunities to improve First Contentful Paint you can select FCP in the Show audits relevant to options.

First Contentful Paint in Chrome DevTools
You can measure FCP in DevTools by creating a Performance recording.
FCP is marked in both the Timings lane and in the Web Vitals lane if you have it enabled. You can also see the rendering progress in the filmstrip.

Measuring First Contentful Paint programmatically
You can get the First Contentful Paint for current page from the Paint Timing API:
performance.getEntriesByName("first-contentful-paint")[0].startTime;
// 581.8749999743886
Monitoring First Contentful Paint
You can use DebugBear can monitor and optimize FCP as well as other page speed metrics.
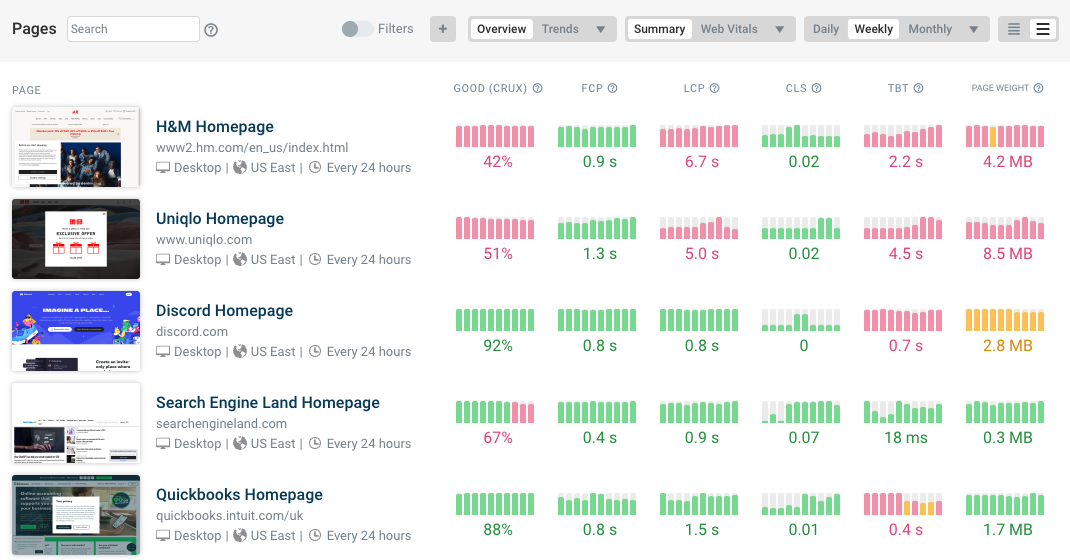
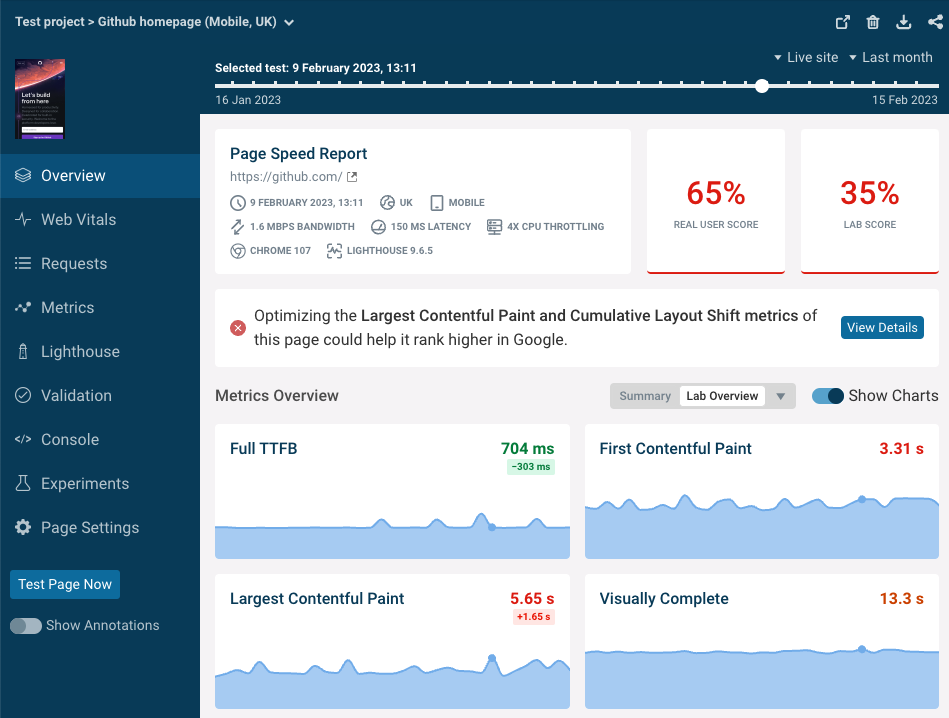
The First Contentful Paint metric is shown in the page Overview tab.
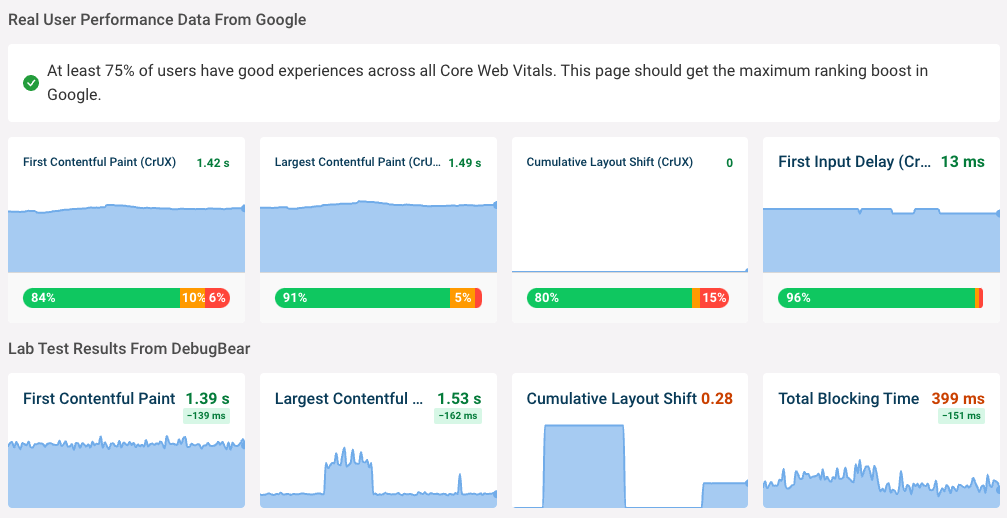
The Web Vitals tab shows both the DebugBear lab data and Google's real world web vitals data that's used as a ranking signal.
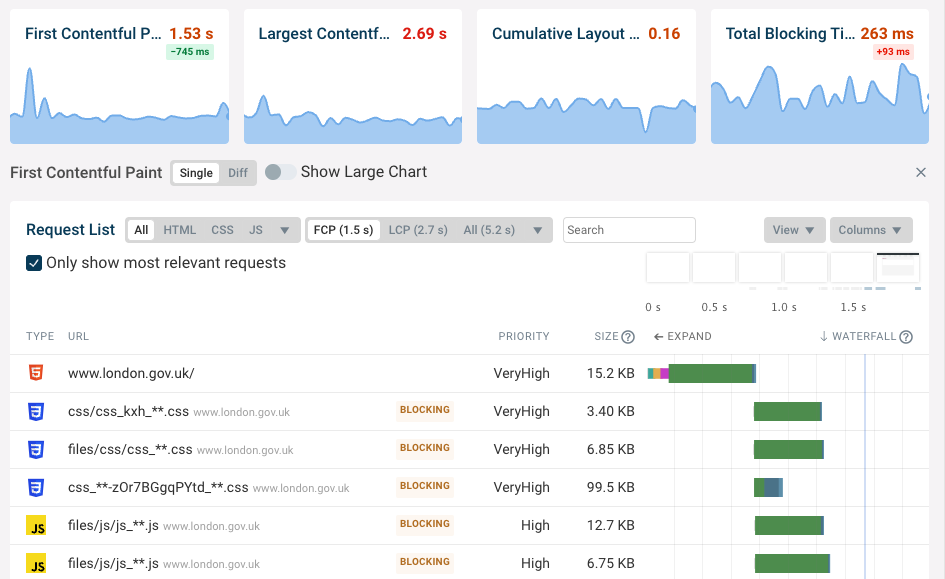
Click on the First Contentful Paint chart title to view the FCP debug view, which highlights render-blocking resources that are holding back rendering in a request waterfall.
Use the project overview to view historical web performance trends including the First Contentful Paint metric.