


This blog post assumes you are already familiar with Apple crash reports and symbolication. If this is not the case, then it is recommended that you first have a look at Apple’s documentation on crash reports in order to familiarize yourself with the general concepts.
Crash reports are an essential tool for any app developer. They provide detailed information on crashes that occurred, allowing you to efficiently locate and resolve them. By themselves, crash reports only contain memory addresses of code locations involved in the crash. In order to actually map these addresses to more easily comprehensible source code locations, the debug information (thedSYMsfiles) of the app is required. Crash reporting tools use this debug info to map addresses to their corresponding source code locations, such as functions. When using Xcode to view your app’s crash reports, this process is automated.
While most iOS developers are very familiar with the crash reporting workflow in Xcode, many don’t know that you can also use LLDB on its own to symbolicate crash reports. In some situations, LLDB will even provide more complete and detailed symbolicated crash reports than Xcode. Xcode does, for instance, not provide inlined debug information in crash reports, leading to incomplete and potentially confusing crash reports. On the other hand, LLDB always shows all inlined debug information in crash reports.
In this blog post, we will show how to symbolicate crash reports using LLDB, how Xcode is limited in the provided symbolicated debug information and why this can have consequences for your crash reporting experience. We will also cover the shortcomings of the crash reporting symbolication by LLDB (for example, there are some cases where LLDB is unable to symbolicate crash reports) and how to deal with each of those cases.
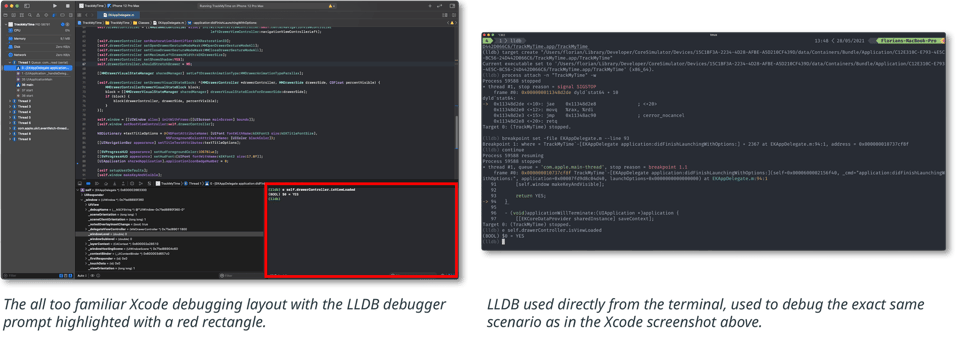
LLDB is the underlying debugger used by Xcode and a core component of the Xcode toolchain. But LLDB is not just an integrated component of Xcode, it can also be used on its own. The screenshots below show how LLDB is integrated into Xcode, and how it can be used from the terminal on its own to debug the exact same scenario.
Next to debugging, LLDB can also be used to symbolicate crash reports. In fact, it actually does a better job at symbolication than most crash reporting tools, and provides more complete information.
You can symbolicate a crash report with LLDB by running the commands in the steps below:
Launch LLDB from your terminal:
$ xcrun lldblldb.macosx.crashlog command script included in Xcode:
(lldb) command script import lldb.macosx.crashlogThe preceding command script defines the crashlog LLDB command, which can then be used to symbolicate the crash report:
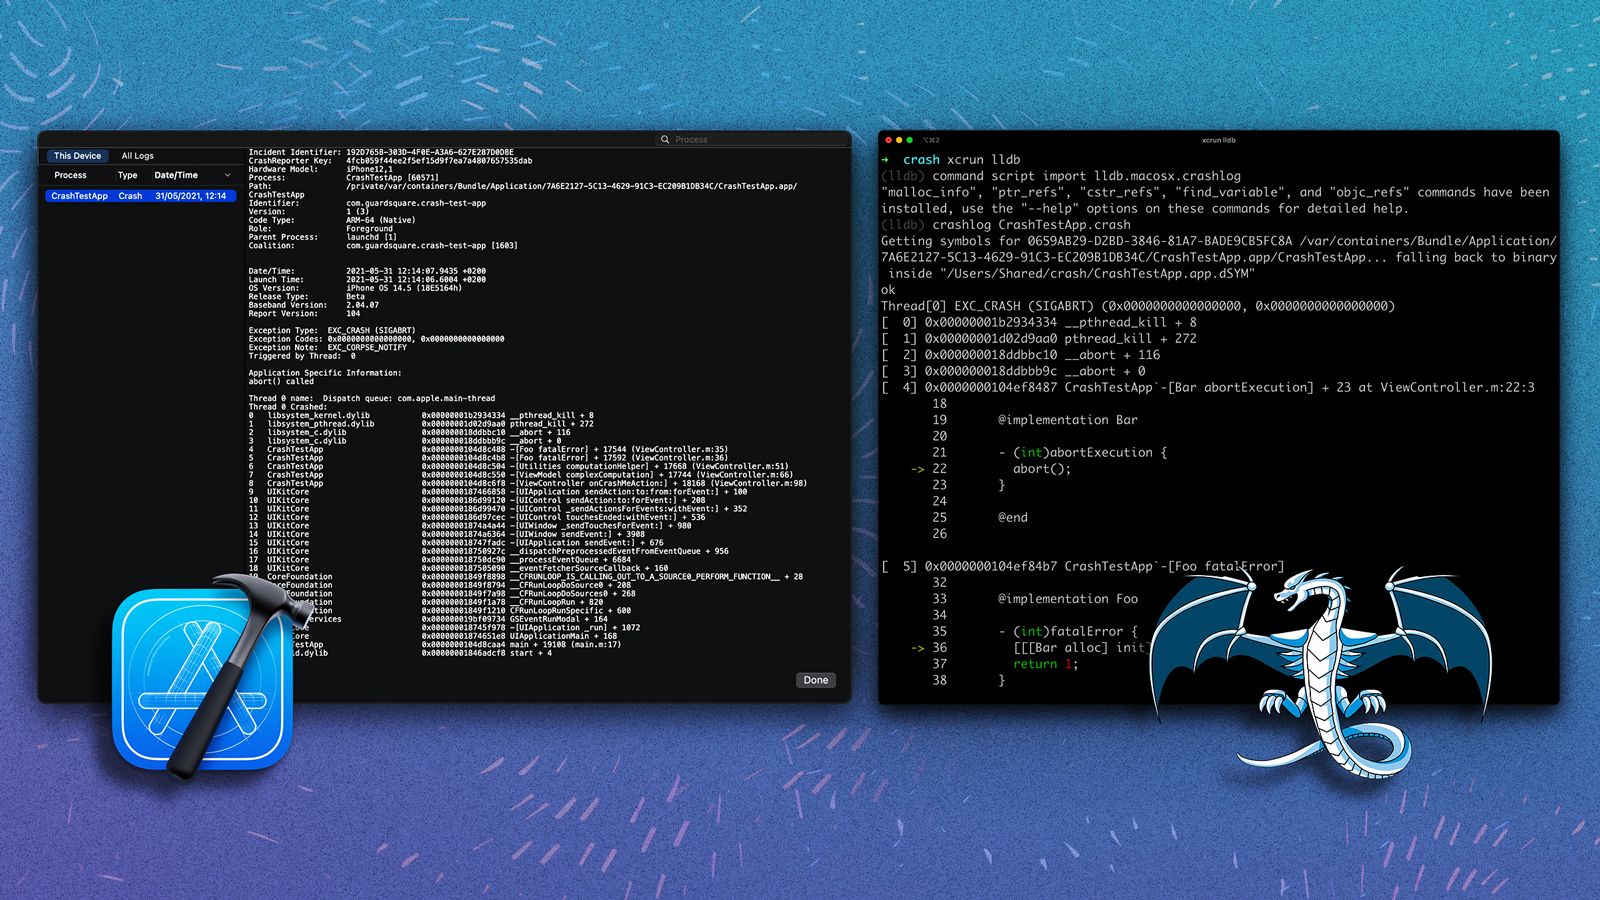
(lldb) crashlog <path/to/crashlog.crash>The crashlog command will symbolicate the complete crash report and enrich the stack trace with source code snippets, resulting in a symbolicated crash report.
Unsymbolicated crash report stack trace:
Thread 0 name: Dispatch queue: com.apple.main-thread
Thread 0 Crashed:
0 libobjc.A.dylib 0x000000019945fdd0 objc_release + 16
1 TrackMyTime 0x000000010080932c 0x100790000 + 496428
2 UIKitCore 0x000000018745bb9c -[UIApplication _handleDelegateCallbacksWithOptions:isSuspended:restoreState:] + 360Thread[0] EXC_BAD_ACCESS (SIGSEGV) (KERN_INVALID_ADDRESS at 0x0000000001e6baf0)
[ 0] 0x000000019945fdd0 objc_release + 16
[ 1] 0x0000000100809320 TrackMyTime`-[EKAppDelegate application:didFinishLaunchingWithOptions:] + 7412 at EKAppDelegate.m:65
[ 2] 0x000000018745bb9c -[UIApplication _handleDelegateCallbacksWithOptions:isSuspended:restoreState:] + 360command script import lldb.macosx.crashlogcommand to your.lldbinit file. That way LLDB will execute the command on launch, automatically making thecrashlogcommand available.
As we’ve already alluded to in the previous section, LLDB does a better job at symbolicating crash reports than most other tools. More concretely, it provides more complete debugging information on application code compared to other tools.
Below, we cover two limitations of crash reporting tools by comparing some specific crash report scenarios for LLDB and Xcode. While we will only go into more detail on Xcode, many third-party crash reporting tools suffer from the same limitations.
Limited name length
Xcode 12.1 (and prior versions) is unable to deal with symbolicating crash reports if debug information names exceed a certain limit. Trying to symbolicate crash reports with very long names using these Xcode versions leads to Xcode crashing. In most cases, this should not be an issue since the character limit for debug information names is larger than any sensible name length. However, in some specific cases, this could be a real issue. For example, when using heavily templated C++ code, types can get very long and names can exceed this limit, thus breaking symbolication for crash reports containing such names.
Inlined debug info
Debug info is used to map addresses within the process back to source code entities. But it is possible that the location of some code in the compiled binary is different from its location in the source code. This is the case for inlined functions, where the function call gets replaced by the body of the called function. This happens essentially by copying the code from the called function into the calling function. In order to make sure that the code can still be traced back to the source location, the inlining also needs to be reflected in the debug information.
This is done by also adding inlined debug information to the inlined code. The debug information of addresses that correspond to inlined code contains multiple levels of information: the original info of the instruction in the source code, and the location at which the instruction was inlined.
For example, this is what an instruction ininlined_function, that was inlined intocalling_function, looks like in a stack trace:
[ 7] 0x000000010270454f App'regular_function + 47 at ViewController.m:66:3
[ 8] 0x00000001027046b4 App'calling_function [inlined] inlined_function at ViewController.m:79
[ 8] 0x00000001027046b4 App'calling_function + 256 at ViewController.m:98Thread 0 name: Dispatch queue: com.apple.main-thread
Thread 0 Crashed:
0 App 0x0000000102704550 calling_function + 17744 (ViewController.m:79)
1 App 0x00000001027046f8 some_function + 18168 (ViewController.m:98)Thread[0] EXC_BAD_ACCESS (SIGSEGV) (KERN_INVALID_ADDRESS at 0x0000000000000000)
[ 0] 0x000000010270454f App`calling_function [inlined] nested_inlined_function + 47 at ViewController.m:66:3
[ 0] 0x00000001027046f7 App`calling_function [inlined] inlined_function + 67 at ViewController.m:74:3
[ 0] 0x00000001027046b4 App`calling_function at ViewController.m:79
[ 1] 0x00000001027046b4 App`some_function + 256 at ViewController.m:98It is clear from the example that Xcode is missing a lot of useful information about the origin of the code in the stack trace. Without this inlined debug information there is no way to know which exact source code corresponds to the frame in the stack trace. In the example above for LLDB, we can clearly see that the code at line 66 caused this particular crash. On the other hand, the stack trace symbolicated by Xcode would lead us to believe that the crash occurred at line 79, which just contains a function call toinlined_function in the source code.
LLDB’s shortcomings
While LLDB has some clear advantages when it comes to the completeness of debugging information in symbolicated crash reports, it’s also important to highlight its shortcomings. Other than requiring manual symbolication and integration, crash reports symbolicated by LLDB can also be incomplete. More concretely, when using crash reports directly exported from your iOS device, as opposed to through Xcode, LLDB is unable to symbolicate system libraries in the crash report by itself. This is because device system library debug information gets synced automatically by Xcode and is used to symbolicate system libraries in crash reports. When exporting directly from the device, this synchronization does not take place, and LLDB will not have access to this debug information. Therefore, we recommend using crash reports exported through Xcode in LLDB to guarantee that system libraries are also fully symbolicated in the crash report.
We already covered how LLDB can be used to symbolicate crash reports and in which cases it is more complete than crash reporting tools. But in some cases, LLDB is not able to symbolicate the crash report. For instance, LLDB can fail at symbolicating the crash report if it is not able to find the dSYMs of the app. But also, when provided with an incomplete or unconventionally formatted crash report, LLDB might be unable to read it.
dSYMs could not be found automatically
LLDB uses Spotlight to locate the dSYMs required to symbolicate crash reports. Therefore, if Spotlight is unable to find the dSYMs, then the same holds true for LLDB. In order to verify whether Spotlight is able to find the dSYMs, you can paste the UUID of the binary in Spotlight search and check if it is able to locate them. The UUID of a loaded binary image can be found in theBinary Imagessection of the crash report
Binary Images:
0x100b58000 - 0x100bd7fff TrackMyTime arm64 <392dd1e6e855334f9ad0af6011729f86>
/var/containers/Bundle/Application/2AFE1CFF-02ED-45C3-88E1-E87D8BDBCAF0/TrackMyTime.app/TrackMyTime 0x100f34000 - 0x100f97fff dyld arm64 <30ff59036c17348cb2f0bb93dbc8f07a> /usr/lib/dyld.xcarchivefiles, where LLDB is not able to find them. In order for LLDB to locate them, thedSYMsfolder needs to be moved outside the XCArchive. Binary Images:
0x104d10000 - 0x104dfbfff App arm64 <UUID>
/private/var/containers/Bundle/Application/.../App.app/App Binary Images:
0x104d10000 - 0x104dfbfff App arm64 <UUID>
</path/to/dSYMs/App.app.dSYM/Contents/Resources/DWARF/App>
crashlogcommand is only able to read and symbolicate crash report files that adhere to the Apple crash report format. Some crash reporting tools can provide crash reports in other formats, such as BugSnag. Some do not give access to the crash file itself at all, like Firebase Crashlytics. Even in such cases, we can still leverage the full debug information that LLDB presents by performing manual lookups./path/to/dSYMs/App.app.dSYM/Contents/Resources/DWARF/. In this case, we will load it for ARM64, since the crash occurred on ARM64.(lldb) target create --no-dependents --arch arm64 <path/to/dSYMs/App.app.dSYM/Contents/Resources/DWARF/App> Current executable set to '<path/to/dSYMs/App.app.dSYM/Contents/Resources/DWARF/App>' (arm64).(lldb) target modules load --file <App> __TEXT 0x104d10000
section __TEXT loaded at 0x104d10000(lldb) image lookup -a 0x00000001027046b4
Address: CrashTestApp[0x00000001000046b4] (CrashTestApp.__TEXT.__text + 580)
Summary: CrashTestApp`-[ViewController onCrashMeAction:] + 256 [inlined] crash_me_inlined_deep at
ViewController.m:79
CrashTestApp`-[ViewController onCrashMeAction:] + 256 [inlined] crash_me_inlined at
ViewController.m:98
CrashTestApp`-[ViewController onCrashMeAction:] + 256 at ViewController.m:98To sum up, LLDB is more than just a debugger. It can also be used to symbolicate crash reports. Many crash reporting tools lack support for inlined debug information, which can lead to incomplete or confusing crash reports. While LLDB requires more manual work, it always provides full inlined debug information for application code. Even though there are some cases where LLDB can’t symbolicate crash reports out of the box, the post above walks through some simple ways to deal with each of them.
So what is the practical takeaway? Whenever you encounter a crash report that does not make sense or seems incomplete, remember that code might have been inlined and that you are only looking at a part of the full stack trace. When investigating your app crash, make sure to use LLDB on an Xcode-exported crash report to be certain that you have full inlined debug information available.
