Spectral Coherence between Gravity and Bathymetry Grids
Alexey Pechnikov
Founder & Developer, InSAR.dev & Geo3D.dev | Geoscience, CS & ML Expert, MSc. Radiophysics
Important note: we use only cross-platform Open Source Software and Open Datasets for our publications. You can free download the used software and data.
Below we reproduce by modern way a research paper "9.1 Computing Coherence on 2-D Grids" from "The IHO-IOC GEBCO Cook Book", contributed by K. M. Marks, NOAA Laboratory for Satellite Altimetry, USA. See also more detailed explanation of the original approach in a paper "Radially symmetric coherence between satellite gravity and multibeam bathymetry grids" (Marks and Smith, 2012).

Figure 9.1 Multibeam bathymetry (left) and marine gravity (right) on the northern flank of the Pacific- Antarctic spreading ridge. See chapter "9.1 Computing Coherence on 2-D Grids" of the "The IHO-IOC GEBCO Cook Book".
There are many gaps in the multibeam bathymetry data which need to be interpolated or filled from other data sources. That's interesting to check recent GEBCO_2019 topography dataset for this area which includes the multibeam bathymetry dataset. See below the same area cropped to the bounds where is the best detailed multibeam bathymetry data.

The multibeam bathymetry dataset provides a set of resolutions from ~100m and above. That's better than 15 arc-second resolution of GEBCO_2019 dataset (~500m) while GEBCO_2019 provides the same data with filled holes. In this way for for further consideration we can use GEBCO_2019 data with grid resolution 500m instead of the multibeam bathymetry data with interpolated values as in the original paper which based on outdated GEBCO_2014 dataset. However we can use the multibeam bathymetry data and GEBCO_2019 together to produce a better resolution grids.
By the same way we can compare modern Sandwell and Smith Gravity Anomaly 2019 dataset and WGM2012 Free-Air Gravity Anomalies dataset.

The datasets are very similar while Sandwell and Smith Gravity Anomaly grid provides 1 arc-minute resolution vs 2 arc-minute resolution of WGM2012 Free-Air Gravity Anomalies grid. Thus when we select grid resolution 500m the Sandwell and Smith dataset is better.
Because we have the complete data grids without large holes, we can use standalone Universal Transverse Mercator (UTM) coordinate system for study area (EPSG code 32702). The original paper provides a special approach to select rotated coordinate system for data with large holes but it's hard to do regularly for different areas.
Now we may compare the selected areas of GEBCO_2019 and Sandwell and Smith datasets with the same ones from the original paper.

Figure 9.3 Multibeam (left) and gravity (right) grids fully prepared for coherence analysis. See chapter "9.1 Computing Coherence on 2-D Grids" of the "The IHO-IOC GEBCO Cook Book".

There is the output coherence plot for the selected dataset from the paper on picture below:

Figure 9.4 Radial coherence (black line) between grids shown in Figure 9.3. One sigma error bars are plotted. See chapter "9.1 Computing Coherence on 2-D Grids" of the "The IHO-IOC GEBCO Cook Book".
1D coherence plot is less informative than 2D correlogram and the authors provide text description for it:
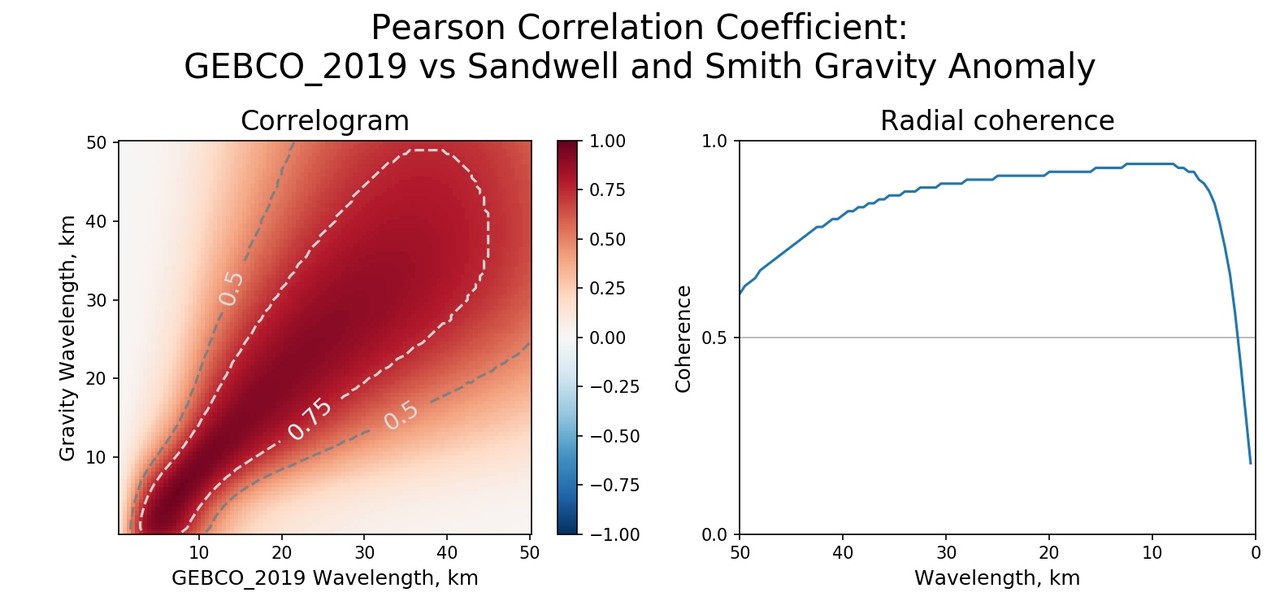
Figure 9.4 shows that gravity and bathymetry anomalies in this study area are coherent in the intermediate wavelength band. Coherence appears to decrease at wavelengths greater than ~100 km because longer wavelength topography is Airy compensated and the gravity signal is cancelled out. At shorter wavelengths, the coherence is low due to upward continuation of gravity from the seafloor to the sea surface. The gravity anomalies in Figure 9.1 (and Figure 9.3) look like a smoothed version of the multibeam bathymetry anomalies because of the upward continuation.
On our 2D correlogram we can see the effect from upward continuation of gravity because GEBCO_2019 wavelengths 4-6km (corresponds to seafloor level) are the most correlated to Sandwell and Smith Gravity wavelength 0-1km. There is also provided the same 1D coherence plot on the picture below:

Therefore, our 2D correlogram analysis is extending the well-known 1D coherence analysis from the original paper. There is the same correlation between the topography data and free-air gravity anomalies and also the different data scales or smoothed data issue issues are easy to analyse too.
See the complete processing code and the source data preparation procedure in this Jupyter notebook (Python3):
Because there is the full correlation between a gravity and a topography data it's possible to enhance gravity by detailed topography data:
P.S. At the notebook you can see also the Density model built by Fractal Dimension Index. That's a very interesting approach, and it's the subject of my next article. There are too many references for this approach to include all of them into this article.
Marks, K.M., Smith, W.H.F., 2012. Radially symmetric coherence between satellite gravity and multibeam bathymetry grids. Mar Geophys Res 33, 223–227. https://doi.org/10.1007/s11001-012-9157-1
International Hydrographic Organization, Intergovernmental Oceanographic Commission, The IHO-IOC GEBCO Cook Book, IHO Publication B-11, Monaco, Sep. 2018, 416 pp - IOC Manuals and Guides 63, France, Sep. 2018, 429 pp, https://www.star.nesdis.noaa.gov/sod/lsa/GEBCO_Cookbook/
The GMT Documentation: (37) Spectral coherence between gravity and bathymetry grids