Bouguer and Free-Air Gravity Anomalies in terms of spatial spectrum
Alexey Pechnikov
Founder & Developer, InSAR.dev & Geo3D.dev | Geoscience, CS & ML Expert, MSc. Radiophysics
Important note: we use only cross-platform Open Source Software and Open Datasets for our publications. You can free download the used software and data.
Bouguer and Free-Air Gravity Anomalies are well-know data products based on measured gravity field. But as we can see by statistical analysis these are outdated conceptions are not applicable for regular high-resolution grids. Let's explain to approve it.
Wikipedia provides a brief and clear explanation for the both of them:
In geodesy and geophysics, the Bouguer anomaly (named after Pierre Bouguer) is a gravity anomaly, corrected for the height at which it is measured and the attraction of terrain. The height correction alone gives a free-air gravity anomaly.
So terrain influence excluded from Bouguer Gravity Anomalies by two ways and from Free-Air Gravity Anomalies by one way. Actually, that's means high-frequency spatial spectrum of terrain couldn't be excluded because there is a cumulative influence of these components to measured gravity while accuracy of the terrain model is limited. We don't know how significant that effect in theory but we can check it on real data.
A Bouguer reduction is called simple or incomplete if the terrain is approximated by an infinite flat plate called the Bouguer plate. A refined or complete Bouguer reduction removes the effects of terrain precisely. The difference between the two, the differential gravitational effect of the unevenness of the terrain, is called the terrain effect. It is always negative.
Ergo by the complete Bouguer reduction definition the terrain effect should be small enough. Otherwise the Bouguer reduction doesn't work properly. We can check it and the result is surprising.
We discussed the same effects for Indonesia before (see my previous Linkedin articles) and now it's more interesting to check some other region. How about Africa? For analysis on large areas we have global WGM2012 Gravity Anomalies grids and GEBCO_2019 topography dataset. WGM2012 uses outdated and no not available GEBCO_2014 for Bougeur reduction and GEBCO_2014 and GEBCO_2019 have many small differences but that's not significant for our analysis scale. Now then the source data on maps:

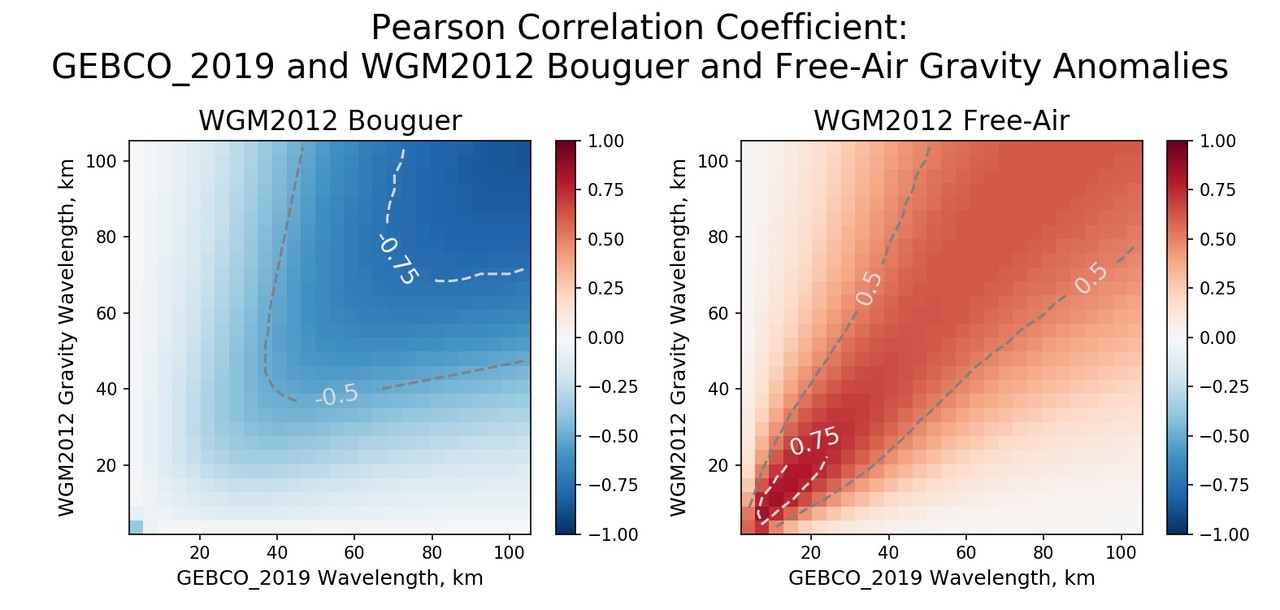
There are the spatial components correlograms:

As we see there is high negative correlation between Bouguer and topography spatial spectrums and high positive correlation between Free-Air and topography spatial spectrums. So the reduction is useless because the terrain effect is the main component of the result products. What is the case of it? The answer is easy - that's the real world fractality effect. Like to coastline length is scale-dependent the Bouguer reduction result depends of the scales of gravity and topography and for any spatial waveband there is the significant correlation between topography and the Bougeur or Free-Air anomalies. That's means the reductions are just corrupt measured gravity and their don't work properly anywhere.
For many practical tasks we can use spatially filtered topography for geological analysis when it's statistically identical to the same band of measured gravity or Bouguer or Free-Air Gravity Anomalies while topography has a much better resolution. Spatially unfiltered data are too noisy in short wavelength scale and high-energy long wavelengths suppress all details. The right way includes a band-pass filtering and processing of the measured gravity and topography. The data processing starts from correlograms comparison for gravity products and topography and defining the identical spectrum components. Because gravity and topography for the selected spatial wavebands are the same, we can select the best-resolution data source for the processing. Also, we can build the composite product. The technique illustrated in this article:
As usual, see prepared Jupyter Python3 notebooks for the source code and the plots: